
Sniper Zone Pro
Indicator
3 purchases
Version 1.0, Jan 2026
Windows, Mac
4.6
Reviews: 3
Description
Sniper Zone Pro Indicator
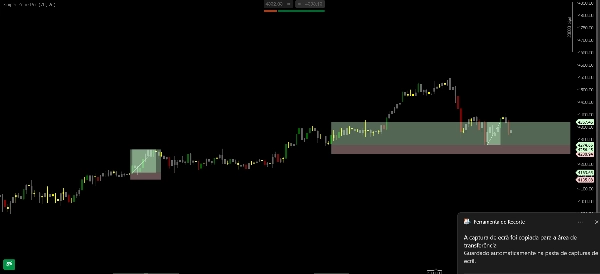
The Sniper Zone Pro is an advanced analysis tool designed to visually identify the footprint of large institutions on the price chart. It combines the mapping of past indecision zones with a candle coloring system that exposes manipulation movements and institutional strength. The indicator transforms market chaos into clear operational regions, allowing traders to identify exactly where the price "fought" and where it tends to test before a new expansion.
Key Features of the Sniper Zone Pro
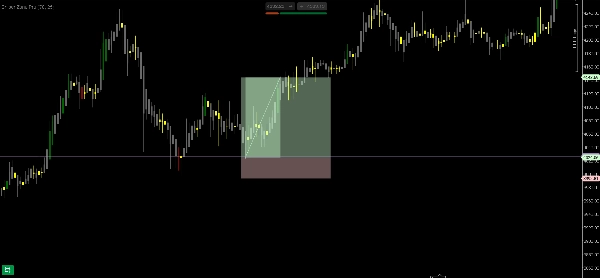
- Mapping of "Battle Zones": Automatically identifies indecision areas where price accumulated volume. These regions become crucial "operating zones," as they represent price levels with significant disputes between buyers and sellers.
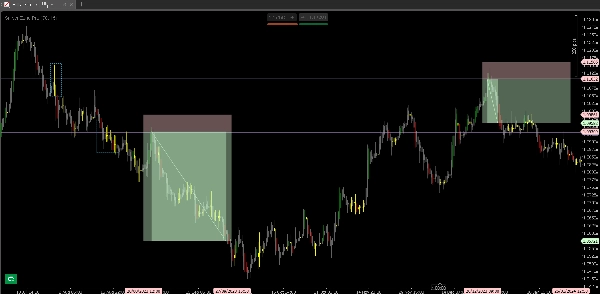
- Active Institutional Coloring: The color system is not merely aesthetic; it highlights candles with institutional movement characteristics (such as high volume or absorption), separating market noise from the intentions of major players.
- High-Probability Test Zones: Upon reaching a key region, the indicator helps visualize whether the price is merely testing the zone or is ready to break through, offering much more precise entry triggers.
- Hierarchy Filter (HTF): Prioritizes interest zones in higher time frames, where price battles have greater technical relevance and the potential for return is significantly higher.
Why Use the Sniper Zone Pro?
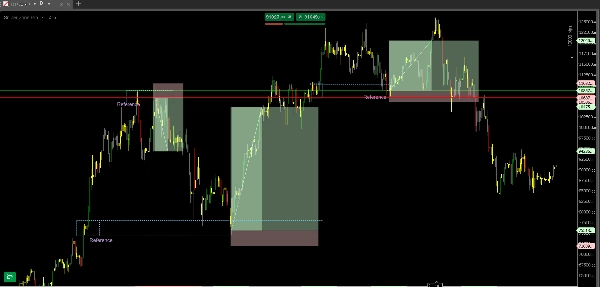
- Market Intent Reading: By observing the candle colors within the battle zones, traders can identify whether institutions are defending that position or abandoning it.
- Defining Operating Zones: Eliminates the doubt of "where to trade." The indicator shows that the best opportunities are not found in the middle of a move, but rather in the tests of regions where the price previously showed indecision.
- Reduction of Subjectivity: Traders stop trying to "guess" tops and bottoms and begin operating based on proven areas of professional interest.
Summary
AI summary
Sniper Zone Pro is an advanced trading indicator designed to visually identify institutional activity on price charts by mapping past indecision zones and applying a candle coloring system that highlights market manipulation and institutional strength. It automatically detects "battle zones" where price accumulated volume, marking key operational areas of buyer-seller disputes. The indicator’s color-coded candles reveal institutional movements such as high volume or absorption, helping traders distinguish significant market actions from noise. It also highlights high-probability test zones, indicating whether price is testing or ready to break through these critical levels. A hierarchy filter prioritizes zones from higher timeframes, emphasizing areas with greater technical relevance. Sniper Zone Pro supports multiple markets including Forex, cryptocurrencies, stocks, commodities, and indices, with tags referencing symbols like BTCUSD, EURUSD, GBPUSD, XAUUSD, NAS100, and USDJPY. The tool aids traders in reading market intent by showing institutional defense or abandonment of price levels, defining precise operating zones to reduce subjectivity, and focusing trading decisions on professional interest areas rather than arbitrary price points.
Indicator profile
Customer reviews
4.6
Reviews: 3
5 | 67 % | |
4 | 33 % | |
3 | 0 % | |
2 | 0 % | |
1 | 0 % |
Customer reviews
January 19, 2026
The best part is random clicks become easier to catch, and a 1R exit plan makes review easier.
January 14, 2026
H1 makes the signal less noisy, and it adds a useful layer without forcing action.
January 5, 2026
No reason to yolo this live without a few normal sessions. The result needs a journal.
Discussion
FAQ
BTCUSD
Forex
Signal
Breakout
Indices
EURUSD
Commodities
GBPUSD
NZDUSD
Scalping
Crypto
Stocks
XAUUSD
NAS100
USDJPY
Products available through cTrader Store, including trading bots, indicators and plugins, are provided by third-party developers and made available for informational and technical access purposes only. cTrader Store is not a broker and does not provide investment advice, personal recommendations or any guarantee of future performance.


Price
Since 11/07/2025
3
Sales