
Description
## 📊 What is Support & Resistance Breaks?
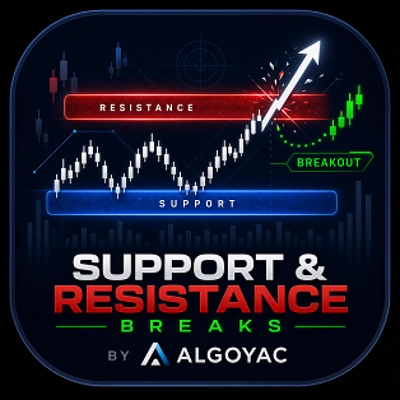
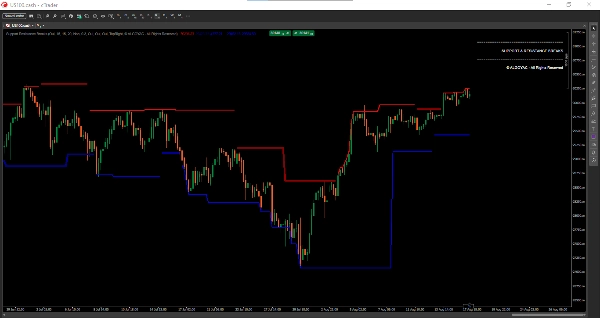
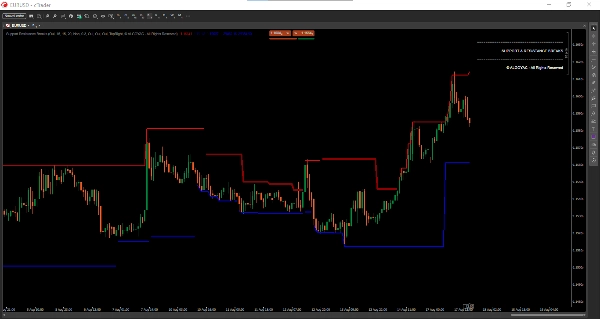
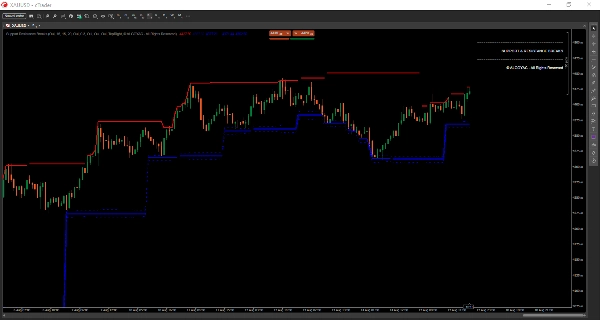
Support & Resistance Breaks is a professional level detection indicator that identifies key price levels in real-time and alerts traders to high-probability breakout opportunities. Unlike traditional indicators that lag, this tool detects support and resistance zones as they form, allowing traders to react quickly to market movements.
The indicator combines pivot point analysis with volume confirmation and a sophisticated scoring system to highlight only the most significant levels.
## 🎯 Key Features
### 1. Real-Time Level Detection
- **No Lag** : Levels are detected as they form, not after the fact
- **Dynamic Updates** : Support and resistance adapt to changing market conditions
- **Automatic Adjustment** : Levels update based on price action
### 2. Level Strength Scoring
Each level receives a strength score (0-100%) based on:
- **Touch Count** (40%) : Number of times price tested the level
- **Volume at Level** (30%) : Trading activity near the level
- **Candle Rejection** (20%) : Quality of price rejections
- **Level Freshness** (10%) : How recently the level was formed
Strong levels (>60%) are displayed with thicker lines:
- **Dark Red/Blue** : Strong levels (high probability)
- **Light Red/Blue** : Standard levels (moderate probability)
### 3. Support/Resistance Zones
- **Configurable Zone Size** : Based on ATR multiplier
- **Visual Zones** : Dotted lines showing the full zone width
- **Realistic Representation** : Zones reflect actual market behavior better than single lines
### 4. Breakout Quality Scoring
Each breakout signal includes a quality score (0-100%) based on:
- **Volume Confirmation** (30%) : Volume surge during breakout
- **Candle Body Size** (25%) : Strength of the breakout candle
- **Close Position** (25%) : Where price closed relative to the range
- **Level Strength** (20%) : Importance of the broken level
**Quality Colors :**
- **Lime** : High quality breakout (>70%)
- **Yellow** : Moderate quality (40-70%)
- **Orange** : Low quality (<40%)
### 5. Breakout Signals
- **"B" Label** : Breakout with volume confirmation
- **"Bull Wick"** : Bullish rejection of support
- **"Bear Wick"** : Bearish rejection of resistance
## 📈 How to Interpret Signals
### Breakout Confirmation
A high-quality breakout (lime "B" label) with strong volume suggests a genuine breakout. Low-quality breakouts (orange) may be false signals.
### Level Testing
When price repeatedly tests a level (multiple touches), the level gains strength. Strong levels are more likely to hold or cause significant reversals.
### Zone Trading
Instead of trading exact levels, use the zones. Enter near zone boundaries, not in the middle.
### Volume Analysis
The volume oscillator (EMA 5 vs EMA 10) helps confirm breakout validity. Breakouts with volume > threshold are more reliable.
## ⚙️ Settings & Parameters
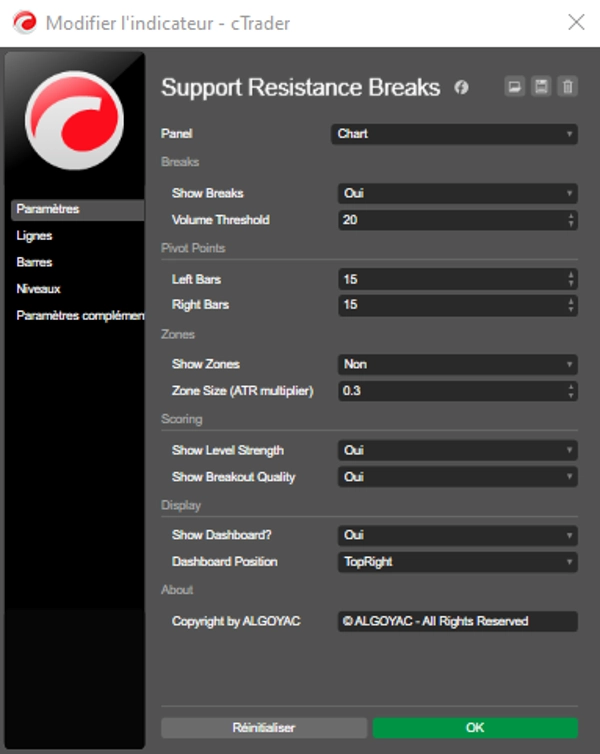
### Pivot Points Group
- **Left Bars** (default: 15) : Number of bars to the left for pivot detection
- **Right Bars** (default: 15) : Number of bars to the right for pivot confirmation
### Breaks Group
- **Show Breaks** (default: true) : Display breakout signals
- **Volume Threshold** (default: 20) : Minimum volume oscillator value for valid breaks
### Zones Group
- **Show Zones** (default: true) : Display support/resistance zones
- **Zone Size** (default: 0.3) : Zone width as ATR multiplier
### Scoring Group
- **Show Level Strength** (default: true) : Display strong vs weak levels
- **Show Breakout Quality** (default: true) : Display quality scores on breakouts
## 💼 Typical Use Cases
### Day Trading
- Use on M15-H1 timeframes
- Enter on high-quality breakouts (lime labels)
- Set stops beyond the zone boundaries
- Take profit at next support/resistance level
### Swing Trading
- Use on H4-D1 timeframes
- Focus on strong levels (>60% strength)
- Wait for price to reach zones before entering
- Use breakout quality for confirmation
### Scalping
- Use on M1-M5 timeframes
- Trade bounces off strong levels
- Quick entries/exits at zone boundaries
- Volume confirmation essential
## 👥 Who is This Indicator For?
### Suitable for:
- **Level Traders** : Identify and trade key levels
- **Breakout Traders** : Catch genuine breakouts with quality confirmation
- **Range Traders** : Trade between support and resistance zones
- **Volume Traders** : Use volume analysis for confirmation
### Experience Level:
- **Beginners** : Clear visual levels and signals
- **Intermediate** : Use scoring for better entries
- **Advanced** : Combine with multi-timeframe analysis
## ⚠️ Important Notes & Limitations
1. **False Breakouts** : Not all breakouts succeed. Use quality scores and volume confirmation.
2. **Level Redundancy** : Too many levels on volatile markets. Adjust Left/Right Bars accordingly.
3. **Zone Width** : Zones can be wide on high ATR markets. Adjust Zone Size parameter.
4. **Not Standalone** : Best used with other indicators (momentum, trend analysis).
5. **Market Conditions** : Works best in trending markets. Ranging markets may produce many false signals.
## 🔧 Recommended Settings
| Market Type | Left Bars | Right Bars | Zone Size |
|-------------|-----------|------------|-----------|
| Forex | 15 | 15 | 0.3 |
| Stocks | 20 | 10 | 0.2 |
| Crypto | 25 | 15 | 0.5 |
| Indices | 15 | 10 | 0.3 |
## 🚀 Getting Started
1. Add the indicator to your chart
2. Observe the initial levels and their strength
3. Wait for price to approach strong levels
4. Watch for breakout signals with quality scores
5. Enter on high-quality breakouts (>70%)
6. Use zones for stop loss placement
---
Summary
The indicator displays configurable support and resistance zones using ATR multipliers, providing a realistic market representation beyond single lines. Breakout signals include quality scores derived from volume surges, candle body size, close position, and level strength, with color-coded quality indicators (lime for high, yellow for moderate, orange for low).
Breakout signals are labeled ("B" for volume-confirmed breakouts, "Bull Wick" for bullish rejections, and "Bear Wick" for bearish rejections). Volume oscillators assist in confirming breakout validity. Settings allow customization of pivot detection bars, zone size, and display options.
Suitable for various trading styles—including day trading, swing trading, and scalping—this indicator supports multiple timeframes and markets such as Forex, stocks, crypto, and indices. It is intended for traders of all experience levels seeking to identify and trade key levels, breakouts, and ranges with volume-based confirmation.
Customer reviews
5 | 50 % | |
4 | 50 % | |
3 | 0 % | |
2 | 0 % | |
1 | 0 % |