
Description
Revolutionize Your Chart Analysis
Step into the future of technical analysis with Delta-RSI Candle Pro – the innovative indicator that transforms ordinary candlesticks into powerful momentum visualizers. Why clutter your screen with multiple indicators when you can have everything you need right on the candles themselves?
The All-in-One Visual Trading Solution
- Immediate Signal Recognition: Momentum strength and direction displayed intuitively through color
- Maximize Screen Real Estate: Eliminate separate oscillator panels forever
- Mathematical Precision: Advanced polynomial regression calculates true RSI momentum
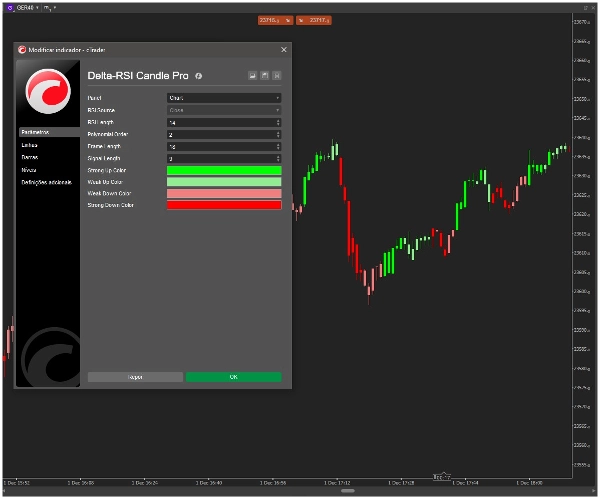
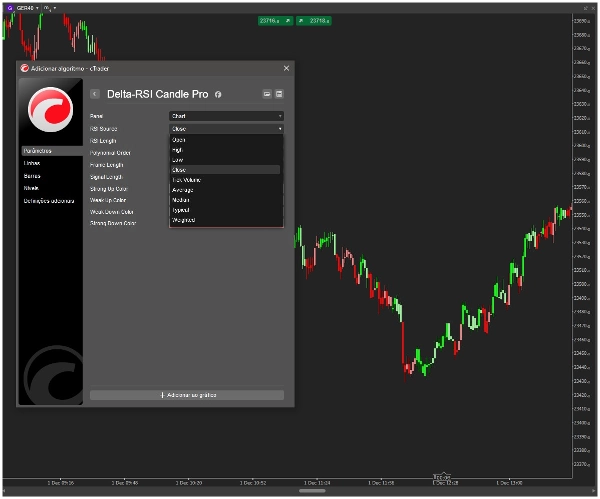
- Complete Customization: Use cTrader's native color pickers to match your trading style
- Reliable & Accurate: Non-repainting calculations based on confirmed price data
How Delta-RSI Candle Pro Works
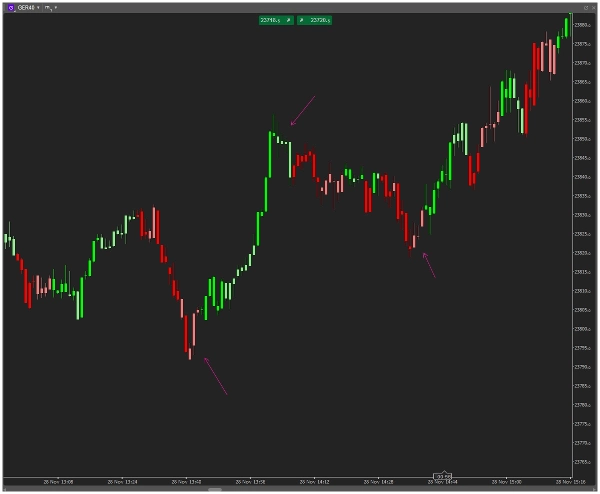
Our proprietary algorithm calculates the instantaneous derivative of RSI using polynomial curve fitting, then assigns intelligent colors to each candle:
- Strong Bullish: Intense green – Positive momentum accelerating
- Mild Bullish: Light green – Positive momentum but caution advised
- Mild Bearish: Light red – Negative momentum but potential reversal
- Strong Bearish: Deep red – Negative momentum accelerating
Key Features That Set Us Apart
- 🎯 Direct Candle Integration: Colors appear directly on your trading candles
- 🎨 Visual Color Selection: Intuitive cTrader color pickers – no code names needed
- ⚙️ Fully Adjustable: Fine-tune RSI length, polynomial order, and lookback period
- 🚀 Optimized Performance: Lightweight calculation engine for smooth operation
- 📊 Professional-Grade Algorithm: Mathematical derivative analysis for superior signals
Who Benefits Most?
- Day Traders needing instant visual momentum cues
- Swing Traders identifying trend changes early
- Minimalist Traders who hate chart clutter
- Algorithmic Traders seeking visual confirmation
- All Serious Traders wanting an edge in market analysis
Get Started in Seconds
- Add Delta-RSI Candle Pro to your chart
- Select your preferred colors using visual pickers
- Adjust parameters to match your trading timeframe
- Immediately see momentum patterns emerge on your candles
Technical Excellence
- Overlay indicator type (no separate panel)
- Non-repainting algorithm
- Polynomial derivative calculation of RSI
- Compatible with all symbols and timeframes
- Regular updates and improvements
Why This Is Different
While other indicators add complexity, Delta-RSI Candle Pro simplifies and enhances. We've taken advanced mathematical momentum analysis and made it visually intuitive. No more dividing attention between price and indicators – now they work together as one cohesive system.
Ready to see your charts in a revolutionary new way?...
Summary
Key features include immediate visual signal recognition through candle coloring, elimination of separate oscillator panels to maximize chart space, and advanced mathematical precision with non-repainting calculations based on confirmed price data. Users can fully customize colors and parameters such as RSI length, polynomial order, and lookback period using cTrader’s native color pickers.
Delta-RSI Candle Pro is compatible with all symbols and timeframes and is optimized for smooth performance with a lightweight calculation engine. It is suitable for day traders, swing traders, minimalist traders, algorithmic traders, and others seeking clear, integrated momentum analysis without chart clutter. The indicator overlays directly on price candles, providing a cohesive system that combines price and momentum information visually.
Customer reviews
5 | 100 % | |
4 | 0 % | |
3 | 0 % | |
2 | 0 % | |
1 | 0 % |


