
Daily Open Color Zones
Indicator
349 downloads
Version 1.0, Sep 2025
Windows, Mac
4.0
Reviews: 1
Description
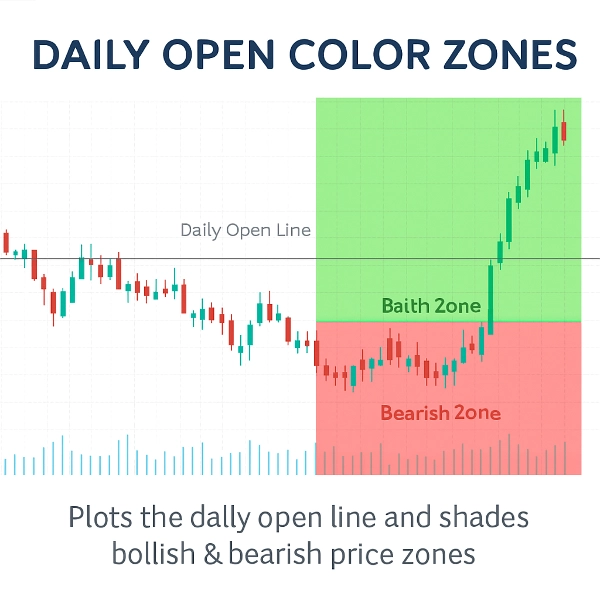
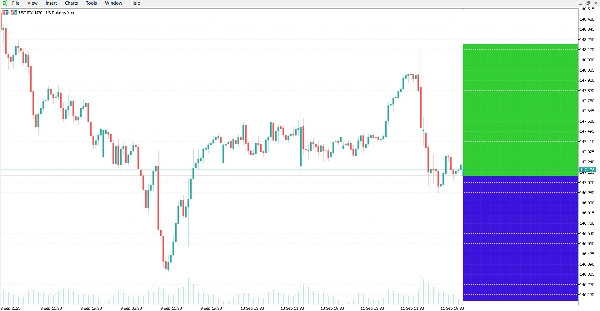
This indicator plots the Daily Open Line and shades the bullish and bearish price zones around it.
It provides a clear visual reference to see whether the market is trading above or below the daily open, which is a commonly used level in intraday analysis.
The indicator automatically draws a horizontal line at the daily open price and highlights the chart areas:
- Green zone above the line (bullish area).
- Red zone below the line (bearish area).
Features:
- Automatic Daily Open Line: precise plotting of the daily open price.
- Color Zones: easily distinguish bullish and bearish areas with customizable colors.
- Dynamic Updates: zones adjust automatically with each new candle.
- Customizable appearance: line style, thickness, and zone colors can be modified.
- Lightweight and efficient: designed for minimal CPU usage.
- Works on all symbols and timeframes.
Conclusion:
The indicator offers a clear chart visualization of the daily open and the related bullish/bearish zones. It can be applied to different markets and timeframes for technical analysis.
Summary
AI summary
The Daily Open Color Zones indicator visually marks the daily open price on trading charts by automatically plotting a horizontal line at this level. It shades the price area above the daily open line in green to indicate bullish zones and the area below in red to indicate bearish zones. These color-coded zones update dynamically with each new candle, providing real-time visual cues about market direction relative to the daily open. The indicator supports all symbols and timeframes, making it applicable across various markets including Forex, cryptocurrencies, and commodities like gold (XAUUSD). Users can customize the line style, thickness, and zone colors to suit their preferences. Designed to be lightweight, it minimizes CPU usage while offering clear intraday reference points commonly used in technical analysis and scalping strategies.
Indicator profile
Customer reviews
4.0
Reviews: 1
5 | 0 % | |
4 | 100 % | |
3 | 0 % | |
2 | 0 % | |
1 | 0 % |
Customer reviews
October 20, 2025
Clean and visual 🎨 - Daily Open Zones make trend bias crystal clear. Great tool for intraday planning and momentum entries!
Discussion
FAQ
Forex
Scalping
EURUSD
Crypto
Grid
XAUUSD
Products available through cTrader Store, including trading bots, indicators and plugins, are provided by third-party developers and made available for informational and technical access purposes only. cTrader Store is not a broker and does not provide investment advice, personal recommendations or any guarantee of future performance.


Price
Since 13/09/2025
27
Sales
5.67K
Free installs