
SwingHighLow
Indicator
10 purchases
Version 1.0, Jul 2025
Windows, Mac
4.3
Reviews: 3
Description
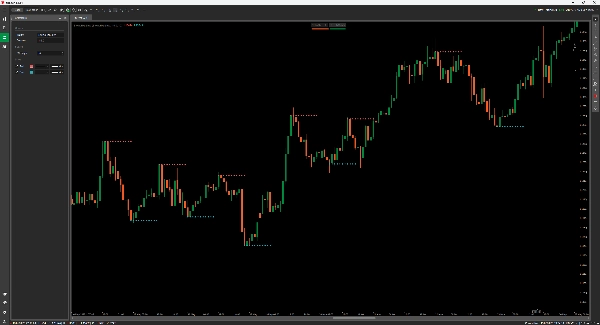
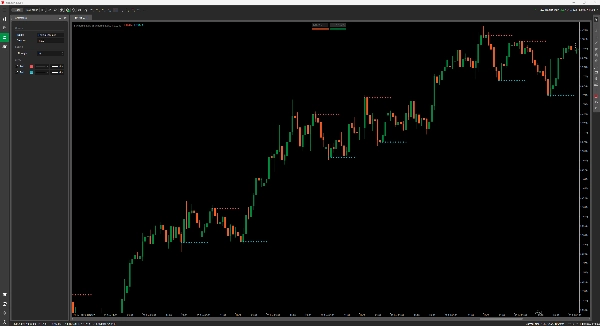
Swing High/Low Indicator for cTrader
Map Market Structure Like a Pro.
This Swing High/Low indicator automatically detects and plots significant turning points on your chart—perfect for traders who rely on price action, structure, and support/resistance zones.
Features:
- Highlights confirmed swing highs (red) and swing lows (blue) with clean point plots.
- Adjustable Strength parameter lets you filter out noise or tighten signals.
- Ideal for trend analysis, reversal spotting, and breakout traps.
Works on all timeframes. No repainting. Just solid market structure, clearly marked.
Summary
AI summary
The SwingHighLow indicator for cTrader automatically detects and plots significant swing highs and lows on price charts, aiding traders in identifying market structure, price reversals, and support/resistance zones. It highlights confirmed swing highs in red and swing lows in blue with clear point markers. The indicator includes an adjustable strength parameter that allows users to filter market noise or tighten signal sensitivity according to their trading preferences. It is suitable for use across all timeframes and supports analysis for various markets including Forex, indices, commodities, stocks, and cryptocurrencies such as BTCUSD, EURUSD, and XAUUSD. The tool is designed to assist with trend analysis, spotting reversals, and identifying breakout traps without repainting, providing consistent and reliable market structure visualization.
Indicator profile
Customer reviews
4.3
Reviews: 3
5 | 67 % | |
4 | 0 % | |
3 | 33 % | |
2 | 0 % | |
1 | 0 % |
Customer reviews
July 22, 2025
Good support for rules for swing point analysis. it helps identify turning points and cleaner structure, especially when used for reviewing reversals, pullbacks and swing zones. Swing points look better after 3 pivots, especially when the 0.5 Fib area agrees with structure. The level is useful when it supports the market story.
July 21, 2025
July 21, 2025
Practical choice for demo for a more controlled workflow. It helps with reviewing reversals, pullbacks and swing zones, but the signal still needs broader context. Swing points look better after 3 pivots, especially when the 0.5 Fib area agrees with structure. I would still keep manual review in the process.
Discussion
FAQ
BTCUSD
Forex
Signal
Breakout
Indices
EURUSD
Supertrend
Commodities
Stocks
XAUUSD
ATR
Products available through cTrader Store, including trading bots, indicators and plugins, are provided by third-party developers and made available for informational and technical access purposes only. cTrader Store is not a broker and does not provide investment advice, personal recommendations or any guarantee of future performance.


Price
Since 03/01/2025
638.03K
Traded volume
21.34K
Pips won
15
Sales