Brokers & props
For business
00
Days
:
00
Hours
:
00
Minutes
:
00
Seconds
SupertrendChannels
"SupertrendChannels" logo
Since 03/01/2025
Traded volume
638.03K
Pips won
21.34K
Sales
9
"SupertrendChannels" uploaded image"SupertrendChannels" uploaded image

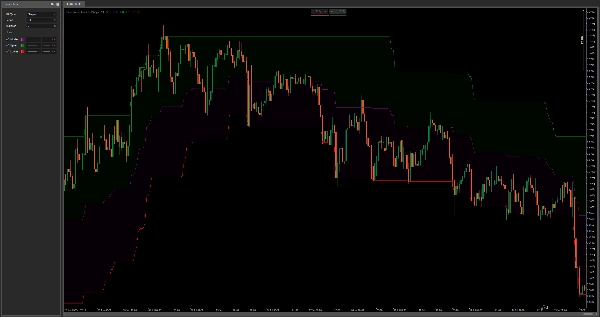
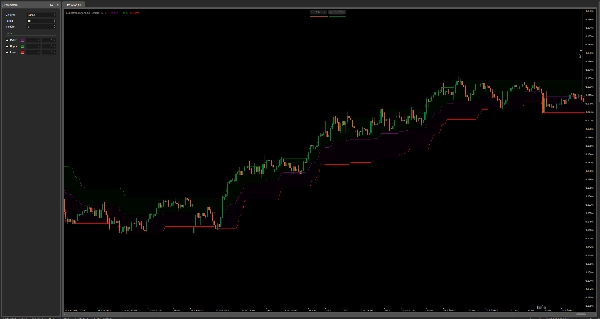
Supertrend Channels is a custom overlay indicator designed to help traders visually identify dynamic support and resistance zones, entry signals, and trailing stop-loss levels using ATR-based logic.

The indicator plots three lines:

  • Upper Band (Green) – acts as a dynamic resistance or trailing stop-loss for long trades.
  • Lower Band (Red) – acts as dynamic support or trailing stop-loss for short trades.
  • Middle Line (Purple) – serves as a mean-reversion level or potential entry point.

It calculates bands using the Average True Range (ATR) multiplied by a user-defined factor (Multiplier) and adds/subtracts that from the high/low of the current candle. A smoothing method (selectable MA type) is applied to the ATR to adjust responsiveness.

How to Use:

  • Entry: Look for entries near the middle line during consolidations or after crossing signals.
  • Trailing Stop-Loss: Use upper/lower bands as dynamic exit zones to lock in profit as trends extend.
  • Support & Resistance: These bands act like adaptive zones that reflect recent volatility and help spot potential turning points.

Unlike standard Bollinger Bands, this approach anchors bands off price extremes plus volatility, not a moving average, making it more responsive in trending environments and more adaptable for discretionary or algorithmic trading.

0.0
Reviews: 0
Customer reviews
No reviews for this product yet. Already tried it? Be the first to tell others!
More from this author
SwingHighLow
Auto-detect swing highs/lows. Spot reversals, map structure, and filter noise with adjustable strength.
TrendMagicOptimized
Clean trend indicator using CCI & ATR. Highlights up/down trends with adaptive, no-repaint lines.
Fisher_m11
Fisher Transform with smoothing. Spot reversals and cycles with precision. Great for any market, any timeframe.
LaguerreRSI
Laguerre RSI: smoother, faster RSI with less noise. Great for spotting reversals and timing entries.
VixFix
A volatility spike detector based on Larry Williams’ VIX Fix. Highlights market fear moments with clear histogram signal
HTFBB
Plot higher-timeframe Bollinger Bands for clearer structure, pullback zones, and breakout signals—without switching char
IBSBot
Buy-only IBS bot for indices on Daily timeframe. Enters near lows, exits near highs. No noise, just clean reversion.
SupertrendHTF
Overlay higher-timeframe SuperTrend to filter noise, follow real trends, and avoid lower-timeframe whipsaws. As
You may also like
Indicator
Indices
Breakout
Stocks
+3
Gann_Pivot_Vision
Gann Pivot Vision is an innovative analytical tool that combines classic pivot reversal levels and Gann geometry
Indicator
ATR
Supertrend
supertrend
Supertrend Indicator for cTrader
Fair Value Gap
FVG Detector: Identify and label Fair Value Gaps, with age, status & multi-timeframe support.
TDI_Pro
Traders Dynamic Index (TDI) — Divergence Edition
Indicator
NAS100
NZDUSD
Martingale
+26
Volume Delta
Read aggressive flow in real time. Flexible resets (Day/Week/Month), optional EMA smoothing, and non-repainting cumulati
IR Candle MTF
with this indicator you could see other time frame candle in your chart.
Previous Day Liquidity Zones (PDH - PDL)
Useful indicator for traders who want to visualize key price levels based on previous daily highs and lows.
Indicator
NAS100
NZDUSD
Breakout
+12
Market Profile Pro_noSourceCode
Market Profile Pro: Volume-based POC/VAH/VAL levels, configurable sessions, transparent histograms, multi-day support
Market Session V3_NSC
Version 3: Full control of session display including start and end times of all 3 sessions!
Indicator
Indices
Prop
Stocks
+3
Smooth Heiken Ashi
The Smooth Heiken Ashi indicator is a refined charting tool designed to filter out market noise and highlight true price
Market Entropy
Market entropy + DC. Spot crystallization/chaos shifts with an optional on-chart overlay.
Donchian Flux Cloud
Trend-coloring Donchian cloud that highlights volatility squeezes and breakouts.
Indicator
Grid
NAS100
NZDUSD
+19
Supertrend-algo
Algorithmic trend precision for cTrader.
Indicator
NAS100
NZDUSD
Martingale
+26
Smart Bar Predictor
🔮 Smart Bar Predictor - Professional Volatility Forecasting Indicator
Indicator
Indices
RSI
Commodities
+1
OrderPrice-V3
A straightforward yet effective tool signals entry points for both buying and selling. Include 3 Moving Average
Indicator
NZDUSD
XAUUSD
Stocks
+7
Signals Volatility Cloud Breakout
🎯Generate precise BUY/SELL signals. 📈🎯 Tracks trends with colored candles & clouds.
Indicator
NAS100
NZDUSD
XAUUSD
+8
Squeeze Breakout Regression System
💥Detects moments when the market is "compressed" and about to explode in any direction 💥