
ATR Bands
Indicator
5 purchases
Version 1.0, Oct 2025
Windows, Mac
4.6
Reviews: 3
Description
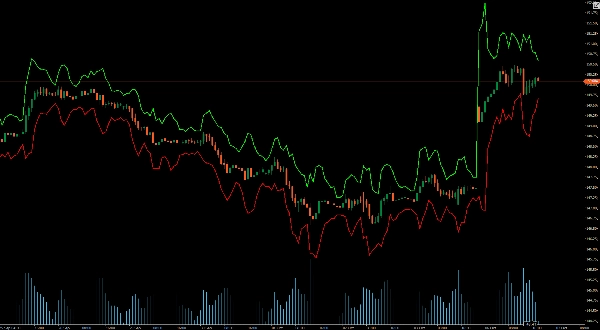
ATR Bands dynamically displays upper and lower bands on your price charts.
These bands offer real-time insights into market volatility, helping you identify potential breakout and reversal points with precision. Perfect for traders of all levels, ATR Bands enhance your decision-making process by providing clear visual cues for setting stop-losses, take-profits, and optimizing entry points.
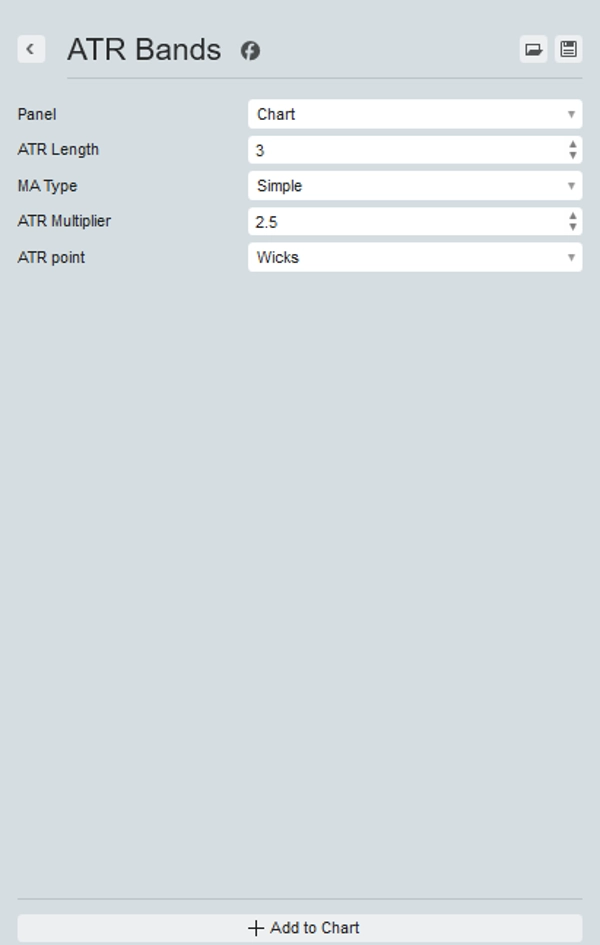
The settings allow to choose your preferred period and multiplier, change the moving average used to calculate ATR and use candle wicks or candle close.
Upgrade your trading toolkit today and experience the difference with ATR Bands – your edge in the market.
Summary
AI summary
ATR Bands is a trading indicator that dynamically plots upper and lower bands on price charts based on the Average True Range (ATR). These bands provide real-time visualization of market volatility, assisting traders in identifying potential breakout and reversal points. The indicator supports customizable settings, including the choice of period and multiplier, selection of the moving average type used to calculate ATR, and the option to base calculations on candle wicks or candle closes. ATR Bands are applicable across various markets such as Forex, cryptocurrencies (e.g., BTCUSD), commodities, indices, and stocks. By offering clear visual cues, this tool aids in optimizing entry points, as well as setting stop-loss and take-profit levels.
Indicator profile
Customer reviews
4.6
Reviews: 3
5 | 67 % | |
4 | 33 % | |
3 | 0 % | |
2 | 0 % | |
1 | 0 % |
Customer reviews
October 19, 2025
weak entries have a harder time slipping through, but risk control still needs say no.
October 14, 2025
The better read comes from there is a useful pause before the click, and a few signals across sessions tell more.
October 13, 2025
Discussion
FAQ
BTCUSD
Forex
Breakout
Indices
EURUSD
Commodities
GBPUSD
NZDUSD
Prop
Crypto
Stocks
XAUUSD
NAS100
ATR
USDJPY
Products available through cTrader Store, including trading bots, indicators and plugins, are provided by third-party developers and made available for informational and technical access purposes only. cTrader Store is not a broker and does not provide investment advice, personal recommendations or any guarantee of future performance.


!["Gaussian Channel [Iridio Capital]" logo](https://cdn.ctrader.com/image/webp/7c039209-5573-4a54-a072-f9528b503103_41960)


Price
Since 25/09/2025
25
Sales
315
Free installs