"RT VWAP" logo
RT VWAP
0.0
03/09/2025
2
Desktop

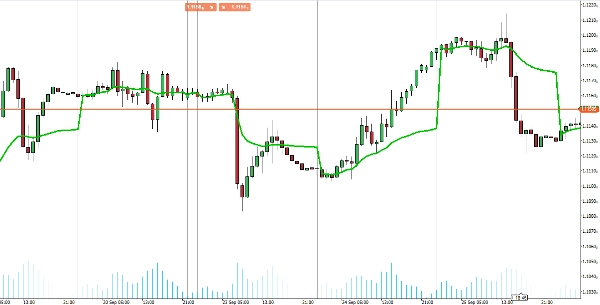
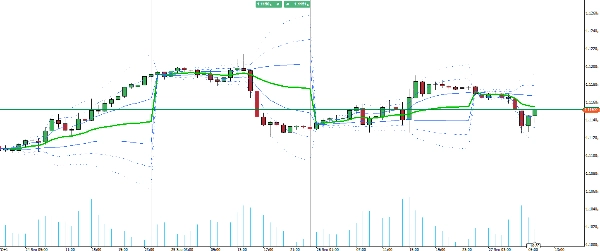
Introducing the VWAP indicator for cTrader, bringing the full functionality of TradingView's Volume Weighted Average Price to your trading platform.

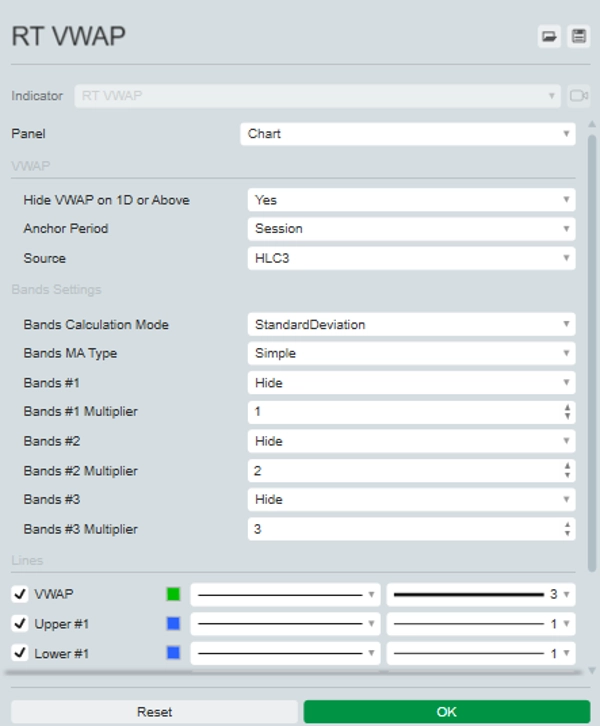
This comprehensive tool allows you to choose your anchor period (Session, Week, Month, Quarter, Year) and select from various price sources, including Open, High, Low, Close, HL2, HLC3, OHLC4, and HLCC4. Additionally, it can display up to three standard deviation upper and lower bands, providing a complete view of price distribution.

The VWAP indicator updates in real time with tick data, ensuring you have the most accurate and timely insights for your trading decisions. Elevate your trading strategy with the versatile and powerful VWAP indicator in cTrader.

More from this author
RT MACD
Customize the MACD! Choose colors, get real-time tick updates, and see crossover points for enhanced trading precision.
RT Chandelier Exit
Optimize exits with Chandelier Exit! Visualize stop-loss points dynamically for improved trading precision and safety.
Indicator
breakout
atr
RT ATR Bands
Enhance trading with ATR Bands! Visualize market volatility using dynamic upper and lower ATR bands for precise decision
Indicator
breakout
RT Standard Deviation Channel_noSourceCode
Visualize trends with Standard Deviation Channel! Display median, and add customizable upper/lower deviation channels.
RT TradingView ATR
Upgrade to ATR-RMA! Experience the precise ATR using Relative Moving Average for accurate volatility analysis in cTrader
Indicator
bollinger
RT Qualitative Quantity Estimation
Unlock trading precision with QQE! Dual QQE indicators with a Bollinger Bands zero line provide clear buy/sell signals.
Indicator
breakout
RT Consolidation Zones
Identify and trade breakouts with Consolidation Zones! Visualize price consolidation areas for trading opportunities.
Indicator
indices
RT True Strength Index
Enhance trading with TSI! Use the True Strength Index for clear insights into market momentum and trend strength.
RT Stochastic RSI PRO
Unlock Stochastic RSI PRO in cTrader! Overlay RSI, highlight zones, and identify divergences with customizable settings.
RT Moving Average PRO v1.1
Customize your Moving Average! Choose any timeframe and price source for precision and flexibility in your analysis.
RT MACD Histogram
Enhance MACD Histogram! Visualize bull and bear price changes with vibrant colors for clearer, more insightful trading.
RT Relative Moving Average
Bring the RMA to cTrader! This is the Relative Moving Average from TradingView.
Indicator
breakout
bollinger
RT Bollinger Bands Cloud
Visualize Bollinger Bands with a colored cloud for clarity. Enhance your trading precision with this dynamic indicator!
RT Time Segmented Volume
Enhance trading with TSV! Analyze volume flow and price trends using the powerful Time Segmented Volume indicator.
You may also like
PVA Volume+Analysis_noSourceCode
PVA Volume Analysis Indicator:Price volume over trend strength and direction
Repiptor RSI Amplified
RSI Amplified
Market Sessions
Market Sessions is very important for traders.
Fury Team E_M_A_su_TF
EMA ON TF (MULTI-TIMEFRAME)
TrendFibonacci
The TrendFibonacci indicator is a powerful tool for traders, combining Fibonacci retracement levels
FAIR VALUE GAP INDICATOR
Pinpoint FVGs, track fills and see mitigation stats — trade imbalances with clarity and confidence.
Indicator
forex
indices
gbpusd
+2
HorizontalSupportResistance
This extraordinary multi-timeframe support and resistance indicator is nothing short of market wizardry.
Renko Line Chart
Smart Signal Reversal Trend + Patterns
HMA MTF 2.0
HMA MTF 2.0 (Multi-Timeframe )
Indicator
breakout
btcusd
supertrend
+6
Volume POC Heatmap
📊 Shows volume by price levels, highlights POC, and key zones. Identifies dynamic support/resistance and imbalances.
E7 cTrader User ID
cTrader ID
Decision Point
Decision Point
VegaXLR - RSI and StochRSI Alerts
VegaXLR's cTrader StochRSI identifies overbought/oversold RSI levels for precise trade entries.
Cumulative Delta Candles + VolumeProfile
Cumulative delta candles + volume profile
E7 Polynomial Regression Channel
Polynomial Regression Channel which also reflects the volatility of the underlying asset.
Indicator
indices
atr
rsi
AlgoCorner Crosshair Edge
Pinpoint, highlight and lock market data easily
Head Shoulders Finder
Detects Head & Shoulders patterns, plots signals, and alerts for trading opportunities.
TraderMaxBBFilterX
TraderMax BB Filter X (FULL) for cTrader 📈 A premium signal tool based on Bollinger Bands + Trend Filter Designed for