
Side Volume Profile
Wskaźnik
11 zakupy
Wersja 1.0, Aug 2025
Windows, Mac
4.3
Opinie: 3
Od 26/05/2025
385.09M
Wolumen transakcji
60.66K
Zysk w pipsach
14
Sprzedaż
1.4K
Bezpłatne instalacje
Opis
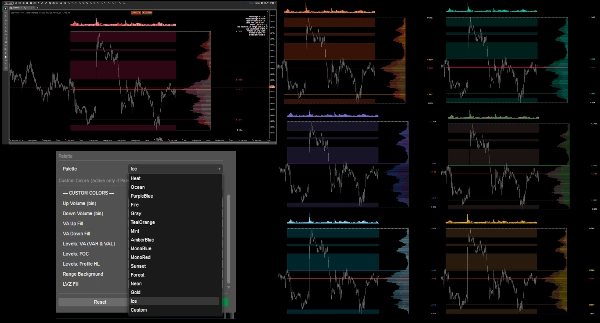
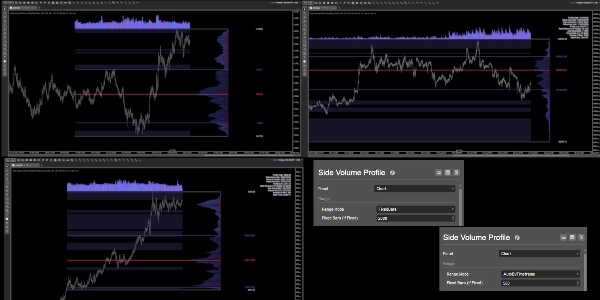
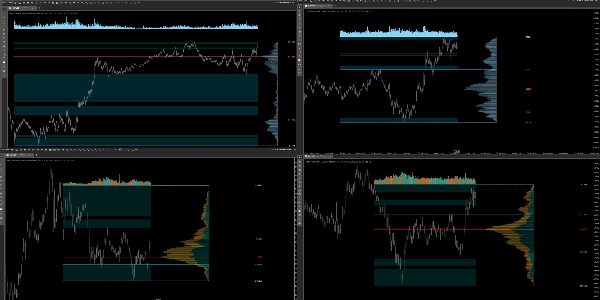
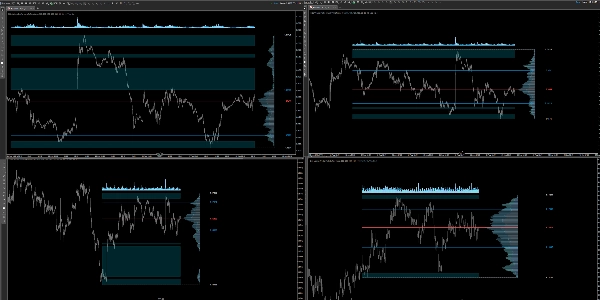
Profil wolumenu po prawej stronie, który jest zawsze przypięty do ostatnich świec i nie przeskakuje podczas przesuwania wykresu. Oblicza wolumen według ceny w wybranym zakresie (automatycznie według interwału czasowego lub stałej liczby świec), pokazuje POC, VAH/VAL, granice profilu (maksimum/minimum), podświetla strefy niskiego wolumenu (LVZ) oraz rysuje histogram wolumenu z EMA powyżej zakresu (przesunięcie w pipsach). Zawiera panel statystyk w prawym górnym rogu, kilka palet o wysokim kontraście oraz kolory niestandardowe, globalną przezroczystość binów, kontrolę szerokości/przesunięcia oraz grubości/stylu linii. Zaprojektowany z myślą o czytelności i wydajności.
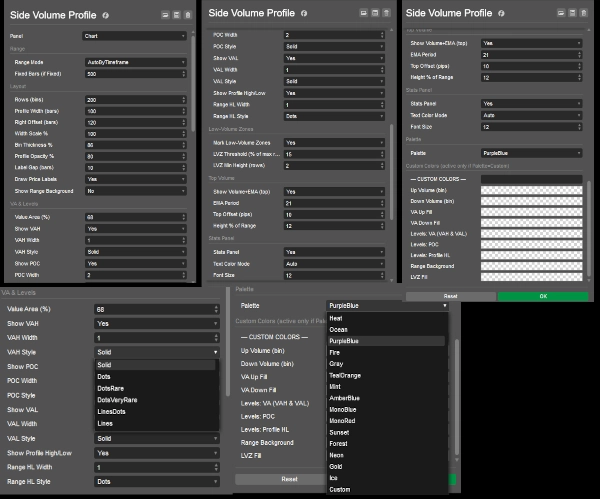
- Zakres: AutoByTimeframe lub FixedBars.
- Układ: Wiersze (biny), szerokość profilu / skala szerokości, przesunięcie w prawo, grubość binu, odstęp etykiet, przezroczystość profilu; opcjonalne tło zakresu.
- VA i poziomy: Procent obszaru wartości, przełącznik VAH/POC/VAL, szerokość i styl linii dla każdego poziomu; maksimum/minimum profilu.
- Strefy niskiego wolumenu: Próg (% maksymalnego wiersza) i minimalna wysokość (wiersze).
- Górny wolumen: Okres EMA, wysokość (% zakresu), domyślne przesunięcie 10 pipsów.
- Paleta/Niestandardowe: Wybierz motyw lub ustaw własne kolory (VAH = VAL).
- Panel statystyk: Przełącznik, rozmiar czcionki
Dokumentacja wskaźnika
Podsumowanie
Podsumowanie AI
Side Volume Profile is a right-anchored volume profile indicator designed for cTrader that displays volume-by-price data over a selectable range, either automatically by timeframe or a fixed number of bars. It visualizes key volume levels including Point of Control (POC), Value Area High (VAH), Value Area Low (VAL), and profile bounds (high/low). The indicator highlights low-volume zones (LVZ) based on configurable thresholds and minimum heights. It also features a volume histogram with an exponential moving average (EMA) offset in pips above the profile range.
Users can customize the layout with controls for row bins, profile width and scale, right offset, bin thickness, label gaps, and opacity. Line widths and styles for VAH, POC, VAL, and profile bounds are adjustable. Multiple high-contrast color palettes and custom color options are available. A toggleable top-right statistics panel provides summary data with adjustable font size.
The indicator supports various markets including Forex, indices, commodities, cryptocurrencies, and stocks, with tags referencing symbols like BTCUSD, EURUSD, GBPUSD, XAUUSD, NAS100, and USDJPY. It is built for readability and performance, maintaining a stable position on the chart without shifting when panning.
Profil wskaźnika
Opinie klientów
4.3
Opinie: 3
5 | 33 % | |
4 | 67 % | |
3 | 0 % | |
2 | 0 % | |
1 | 0 % |
Opinie klientów
Dyskusja
Częste pytania
BTCUSD
Forex
Indices
EURUSD
Commodities
GBPUSD
NZDUSD
Prop
Fair Value Gap
SMC
Crypto
Stocks
XAUUSD
NAS100
USDJPY
VWAP
Produkty dostępne za pośrednictwem cTrader Store, w tym boty handlowe, wskaźniki i wtyczki, dostarczane są przez deweloperów zewnętrznych i udostępniane wyłącznie w celach informacyjnych oraz w celu zapewnienia dostępu technicznego. cTrader Store nie jest brokerem i nie zapewnia doradztwa inwestycyjnego, nie udziela spersonalizowanych rekomendacji ani nie gwarantuje przyszłych wyników.


Cena
Od 26/05/2025
385.09M
Wolumen transakcji
60.66K
Zysk w pipsach
14
Sprzedaż
1.4K
Bezpłatne instalacje