
Descrizione
---------------------------------------------------------------------------------------
Annuncio di Aggiornamento
Siamo entusiasti di annunciare un aggiornamento chiave per il nostro indicatore EnhancedSupportResistance! Questo aggiornamento si concentra sul miglioramento della gestione degli oggetti del grafico, garantendo che le tue annotazioni e disegni personalizzati rimangano intatti.
Novità:
- Rimozione Selettiva degli Oggetti: Il nostro indicatore ora rimuove selettivamente solo gli oggetti che crea, prevenendo la cancellazione accidentale di oggetti del grafico non correlati.
- Esperienza Utente Migliorata: Goditi un'esperienza più fluida e affidabile, con le tue annotazioni e disegni importanti intatti dagli aggiornamenti dell'indicatore.
---------------------------------------------------------------------------------------
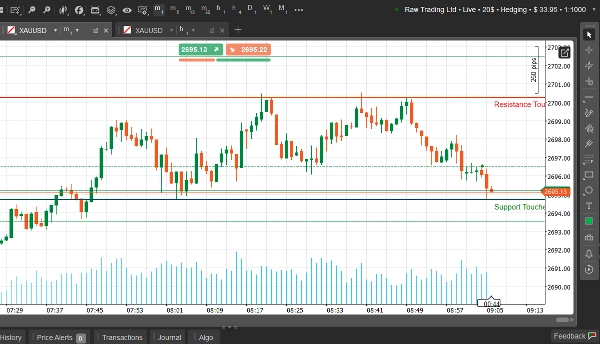
LevelMaster S/R - Padroneggia i Livelli Chiave del Mercato
Descrizione:
LevelMaster S/R è un indicatore di trading potente e progettato con precisione per darti un vantaggio identificando accuratamente i livelli critici di supporto e resistenza. Creato per trader di tutti i livelli, questo strumento analizza l'azione del prezzo nel timeframe scelto e mette in evidenza le zone più rilevanti, aiutandoti a prendere decisioni di trading informate con fiducia.
Che tu sia uno scalper, un day trader o uno swing trader, LevelMaster S/R fornisce le intuizioni necessarie per navigare mercati volatili e trovare opportunità redditizie.
Caratteristiche Principali:
🔥 Zone Accurate di Supporto e Resistenza
- Rileva automaticamente i livelli più forti basati sull'azione del prezzo, i frattali e i valori ATR.
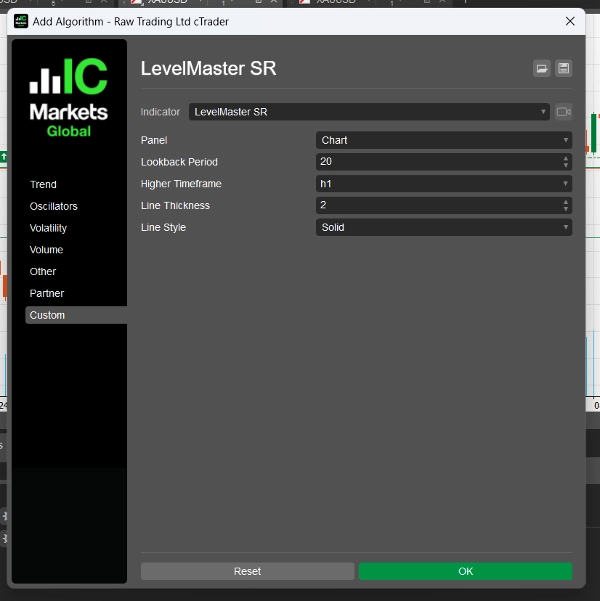
⏱ Analisi Multi-Timeframe
- Analizza e mostra i livelli chiave da qualsiasi timeframe a tua scelta, direttamente sul grafico.
📊 Visualizzazioni Personalizzabili
- Regola stili di linea, colori e spessore per un'integrazione perfetta nel grafico.
🔔 Avvisi in Tempo Reale
- Ricevi notifiche tramite suono, email o mobile quando il prezzo si avvicina ai livelli scelti.
💡 Impostazioni Intuitive
- Opzioni di input intuitive rendono la configurazione rapida e semplice, anche per i principianti.
Perché Scegliere LevelMaster S/R?
✔ Decisioni Migliorate: Smetti di indovinare e inizia a fare trading con fiducia.
✔ Risparmia Tempo: Lascia che l'indicatore faccia il lavoro pesante identificando le zone per te.
✔ Funziona su Tutti i Mercati: Perfetto per Forex, Azioni, Commodities e Crypto.
✔ Creato da Trader, per Trader: Progettato con funzionalità di cui i trader reali hanno bisogno.
Chi Dovrebbe Usare LevelMaster S/R?
- Scalper: Individua zone intraday per operazioni rapide.
- Swing Trader: Identifica livelli forti per movimenti di prezzo più ampi.
- Principianti: Semplifica l'analisi di mercato per un apprendimento facile.
- Professionisti: Migliora le strategie esistenti con dati affidabili.
Riepilogo
Recensioni dei clienti
5 | 50 % | |
4 | 50 % | |
3 | 0 % | |
2 | 0 % | |
1 | 0 % |


![Logo di "[Hamster-Coder] Bollinger Bands"](https://cdn.ctrader.com/image/webp/21d8e5d6-fb11-4bac-b9ee-cd05c2b76804_30327)


