
Descrizione
Support & Resistance Pro identifica le zone di supporto e resistenza e — a differenza della maggior parte degli strumenti S/R — misura se tali zone funzionano effettivamente, utilizzando un motore statistico indipendente basato su dati storici reali anziché su supposizioni. Ogni zona mostra una statistica di tasso di tenuta con un intervallo di confidenza, calcolata dalla popolazione storica completa delle zone, comprese quelle che in seguito si sono rotte e sono scomparse dal grafico. La maggior parte degli indicatori in questa categoria conta solo i livelli ancora visibili oggi, il che gonfia silenziosamente ogni affermazione di forza fatta. Questo no.
Caratteristiche principali
- Zone statisticamente validate Ogni zona porta un vero tasso di tenuta misurato storicamente con un intervallo di confidenza del 95% — non un punteggio di forza presunto. Un segnale, il rifiuto della wick al punto di contatto, è stato formalmente validato: confermato su EURUSD e Bitcoin, su più timeframe, incluso un vero test out-of-sample dove l'effetto ha mantenuto la forza su dati non visti.
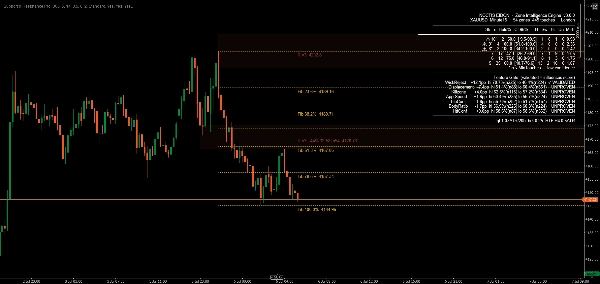
- Inversione automatica del ruolo Il supporto rotto diventa automaticamente resistenza, e viceversa, con un marcatore visivo distinto — l'indicatore traccia su quale lato del prezzo si trova una zona e la colora di conseguenza, invece di fissare il colore in base a come la zona si è originariamente formata.
- Confluenza su timeframe superiori Le zone sul tuo grafico sono confrontate con un timeframe superiore a tua scelta, con la struttura HTF corrispondente disegnata direttamente sul grafico come sovrapposizione visiva separata.
- Integrazione del ritracciamento di Fibonacci Livelli di ritracciamento di Fibonacci automatici dall'oscillazione più recente, ciascuno etichettato con rapporto e prezzo esatto nella precisione nativa del tuo broker, automaticamente decongestionati rispetto alle zone vicine in modo che le etichette non si sovrappongano mai.
- Avviso di saturazione Le zone testate troppe volte vengono segnalate anziché presumere che siano più forti — i nostri dati mostrano che le zone pesantemente testate tendono a performare peggio, non meglio, probabilmente perché la loro liquidità di riposo è già stata consumata.
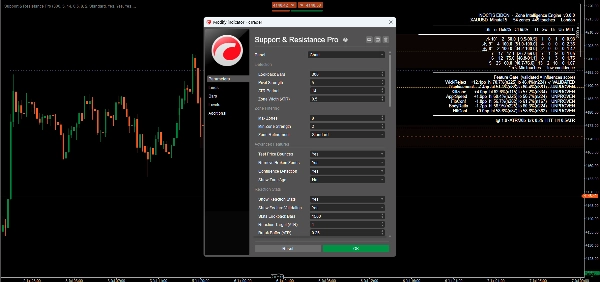
- Porta di validazione aperta Sei segnali candidati aggiuntivi — rapporto del corpo, velocità di avvicinamento, tempistica sessione/killzone e test di spostamento — sono mostrati in tempo reale nel pannello statistico integrato con le proprie letture del tasso di tenuta. Non influenzano alcun punteggio o classificazione finché ciascuno non supera indipendentemente la stessa soglia di evidenza del rifiuto della wick. Vedi esattamente cosa è provato e cosa no.
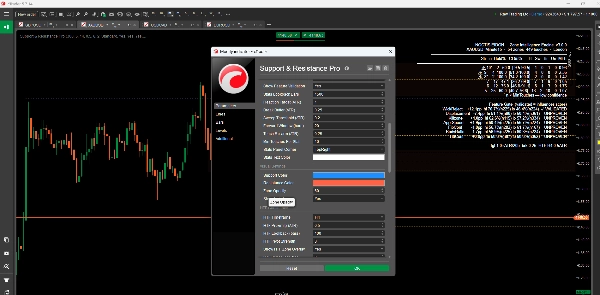
- Impostazioni personalizzabili Ampio controllo dei parametri su sensibilità di rilevamento, filtraggio delle zone, stile visivo e comportamento degli avvisi.
- Avvisi in tempo reale Avvisi configurabili a comparsa, email e suono per tocchi di zona, rotture e eventi di confluenza, attivabili indipendentemente per canale.
Vantaggi
- Evidenza oltre l'assunzione: ogni statistica sul grafico può essere verificata indipendentemente — l'indicatore include i propri strumenti di verifica in-sample/out-of-sample
- Nessun bias di sopravvivenza: le affermazioni di forza si basano sulla popolazione storica completa delle zone, non solo sui livelli che sono sopravvissuti
- Divulgazione onesta: segnali provati e non provati sono etichettati come tali, sul grafico, in ogni momento
Ideale per
Trader che vogliono vedere l'evidenza statistica dietro un livello, non solo una linea — day trader, swing trader e trader sistematici su forex, crypto e altri strumenti che cercano un approccio rigorosamente misurato a supporto e resistenza.
Conclusione
Support & Resistance Pro è costruito attorno a un principio: un'affermazione di forza non è reale finché non viene misurata. Un segnale ha superato quella soglia con conferma cross-strumento, cross-timeframe e out-of-sample. Il resto è mostrato onestamente come ancora in fase di test — perché un numero che non puoi verificare non vale affatto la pena di essere mostrato.
Riepilogo
- Dynamic support and resistance levels that adjust in real-time based on recent price action.
- Multi-timeframe analysis to view levels across different timeframes for a comprehensive market overview.
- Calculation and display of pivot points to mark potential intraday reversal zones and target prices.
- Highlighting of psychological price levels (round numbers) to gauge market sentiment.
- Integration of Fibonacci retracement levels to assist in identifying support and resistance during price corrections.
- Customizable settings for lookback periods, visualization styles, and color schemes to suit individual trading preferences.
- Clear graphical representation for easy identification of market conditions.
- Configurable real-time alerts when prices approach critical levels.
This indicator supports various trading styles including scalping, day trading, and swing trading, and is suitable for traders in forex, commodities, stocks, and indices markets. It is intended for both beginner and experienced traders seeking structured market analysis and enhanced decision-making through reliable support and resistance data.
Recensioni dei clienti
5 | 100 % | |
4 | 0 % | |
3 | 0 % | |
2 | 0 % | |
1 | 0 % |


