
Descrizione
🚀 Oltre 10.000 trader utilizzano già i nostri MIGLIORI indicatori🏆
Scopri perché i professionisti ci scelgono – gli strumenti più potenti su cTrader (indicatori, algoritmi e cBot) ti stanno aspettando.
👉 Ottieni tutti i nostri sistemi TOP qui:
_______________________________________________
📌 Indicatori di Struttura di Mercato
· ✅ AdvancedMarket Structure: Bos, Choch, SwinLevels, Order Blocks, Market Structure& Liquidity Finder
· 🔄 Analisi Dinamica della Struttura di Mercato dei Punti di Inversione
· 🧱 Order Block
· ⛓️ BOS & CHOCH
· 🧠 ICT Power of 3
· 🌀 Zone di Polarità di Mercato
_______________________________________________
🔚 Sistemi di Uscita Intelligenti
· 📍 Algoritmo Intelligente di Trailing
_______________________________________________
📐 Indicatori ZigZag
· 🔍 Proiezione della Liquidità del Prezzo ZigZag
· ➖ ZigZag
· 🎯 Tracciatore di Estremità Zig-Zag
_______________________________________________
🧱 Indicatori di Supporto e Resistenza
· 🟩 Linee di Supporto e Resistenza SmartTrend
· 🧱 Tutti i Livelli di Supporto e Resistenza
_______________________________________________
📊 Indicatori di Trend e Canale
· 📊 Supertrend
· ⚡Analizzatore di Trend Momentum
· 💥 Sistema di Breakout del Canale
· 🌈 Gradiente Dinamico di Trend
_______________________________________________
💧 Strumenti di Volume e Liquidità
· 📉 Mappa di Liquidazione della Leva
_______________________________________________
⚡ Indicatori Momentum e RSI
· 🔎 Tracciatore di Bias a Livelli Multipli di Candele
_______________________________________________
🔮 Strumenti di Predizione e Proiezione
· 📐 Predizione Basata su Linreg& ATR
· 📏 Regressione Lineare di Fibonacci Multi-timeframe
· 📈 Proiettore di Flusso di Mercato Alimentato dal Volume
🟢 Identificazione degli Order Block 🔴
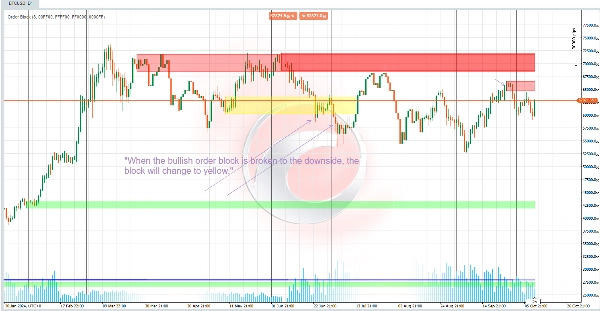
**Order Block Rialzista 🚀:**
Per individuare un order block rialzista:
- Il codice verifica se il prezzo di chiusura attuale supera il punto più alto di un precedente swing ⬆️.
- Se lo fa e quello swing non è ancora stato attraversato, viene segnato come attraversato. L'order block viene quindi definito dal prezzo più basso al più alto nelle candele precedenti 📈.
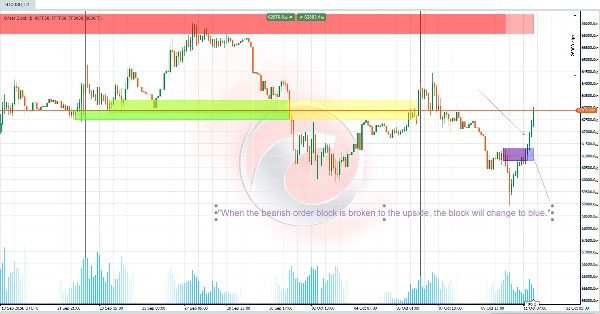
**Order Block Ribassista 🔻:**
- Funziona in modo simile ma si applica agli swing di prezzo basso.
- Un order block ribassista si crea quando il prezzo di chiusura attuale scende sotto il punto più basso di uno swing ⬇️.
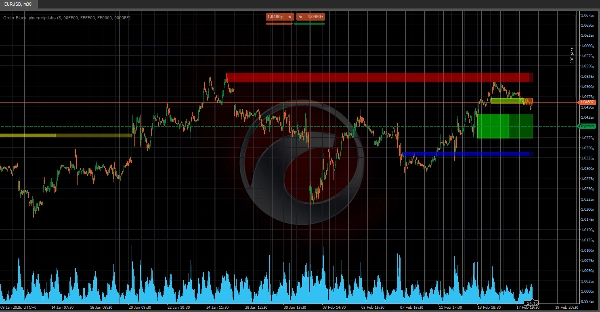
### 💼 Funzionalità degli Order Block 📊
Gli Order Block rappresentano **zone di accumulo ad alto volume** dove grandi operatori di mercato potrebbero aver effettuato scambi significativi
Queste aree spesso fungono da potenziali livelli di supporto o resistenza e possono segnalare la continuazione o l'inversione di un trend 📉📈.
- **Supporto o Resistenza:** Gli order block rotti potrebbero indicare aree rilevanti di supporto o resistenza, a seconda del trend precedente 🔄.
- **Continuazione o Inversione:**
- Una rottura di un order block nella direzione opposta può indicare una potenziale inversione 🔄.
- La rottura nella stessa direzione può confermare la continuazione di un trend 🔗.
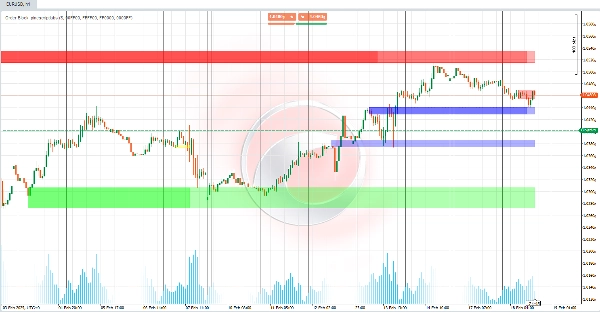
Questo indicatore è potente per identificare **livelli chiave sui grafici** 📈, aiutando i trader a visualizzare aree importanti basate sul comportamento del prezzo in zone ad alto volume. Perfetto per individuare trend e movimenti di mercato! 🎯📊
Riepilogo
Recensioni dei clienti
5 | 100 % | |
4 | 0 % | |
3 | 0 % | |
2 | 0 % | |
1 | 0 % |


