
Descrizione
Indicatori Pinescriptlabs Store: Pinescriptlabs Store cBots : (cBot) Gold & BTC BreakoutSession Pivots(nuovo)
Proiezione Liquidità Prezzo ZigZag
Algoritmo Intelligente a Inseguimento (nuovo)
Mappa di Liquidazione della Leva
Previsione Basata su Linreg & ATR
SmartTrend Supporto &
Resistenza
Linee
Sistema di Breakout del Canale
Analisi
Dinamica
della Struttura di Mercato
dei
Punti
di Svolta
Regressione
Lineare
Fibonacci
Multi-timeframe
Proiezione del Flusso di Mercato
Gradiente di Tendenza Dinamico
Tracciatore
Multi-Livello
Bias delle Candele
Tracker
Tracciatore di Estremi Zig-Zag
Trend
Supporto e
Resistenza
Linee
Tutti
i Livelli di
Supporto e
Resistenza
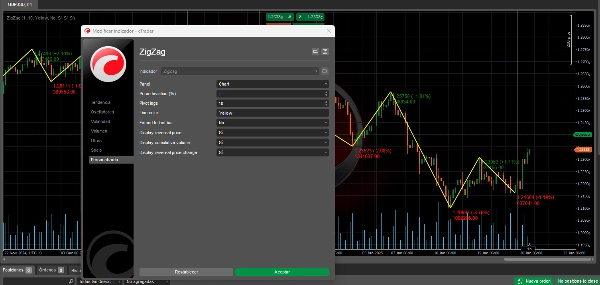
L'Indicatore ZigZag: Semplificare le Tendenze di Mercato 📉📈
Lo ZigZag è un indicatore tecnico che aiuta a identificare cambiamenti significativi di tendenza in un asset filtrando i movimenti di mercato minori. Il suo scopo principale è semplificare l'analisi visiva dei prezzi eliminando il "rumore" delle piccole fluttuazioni.
Come Funziona ⚙️
- 📊 Analizza i prezzi per trovare punti di svolta significativi (pivot).
- 📈 Un punto di svolta è considerato significativo quando il prezzo cambia di una percentuale minima specifica (parametro di deviazione).
- 🔗 Collega questi punti di svolta con linee rette, formando un modello a "zigzag".
- 🕒 Si aggiorna dinamicamente man mano che emergono nuovi dati di prezzo.
Utilità nel Trading 💡
Identificazione della Tendenza 📐
- 🔍 Aiuta a visualizzare la direzione principale del mercato.
- 🚀 Rende più facile individuare tendenze rialziste e ribassiste.
- 📏 Evidenzia chiaramente i livelli chiave di supporto e resistenza.
Analisi dei Modelli 📋
- 🎯 Semplifica l'identificazione dei modelli grafici.
- 🕵️♂️ Evidenzia formazioni di prezzo come triangoli, bandiere e altri modelli.
- 🌊 Migliora la chiarezza nel riconoscere le onde di Elliott.
Gestione del Trade 🎛️
- 🎯 Identifica potenziali punti di ingresso e uscita.
- 🛡️ Aiuta a determinare i livelli di stop-loss basati sui pivot precedenti.
- 🎯 Facilita l'impostazione di obiettivi di prezzo realistici.
Analisi della Volatilità 🌡️
- 📏 La distanza tra i pivot riflette la volatilità del mercato.
- 🧩 Aiuta ad adattare le strategie in base alla dimensione dei movimenti.
- ⏳ Distingue tra periodi di consolidamento e tendenze direzionali.
Conferma del Segnale ✅
- 🔍 Serve come strumento di conferma per altri indicatori.
- 🚪 Valida le rotture di livelli chiave.
- 🔗 Può essere combinato con altri indicatori per strategie più robuste.
Considerazioni Chiave 🧠
È Retrospettivo 📅
- ⏪ I punti pivot sono confermati solo dopo che il movimento si è verificato.
- 🔮 Non è predittivo da solo.
- ⚖️ Deve essere usato in combinazione con altri indicatori per prendere decisioni.
Regolazioni dei Parametri 🔧
- 🎚️ La sensibilità dipende dalla percentuale di deviazione impostata.
- 🔍 Una percentuale più piccola mostra più punti pivot.
- 🧹 Una percentuale più alta filtra i movimenti minori, mostrando solo i cambiamenti significativi.
Uso del Timeframe 🕒
- 🕰️ Funziona su qualsiasi timeframe.
- 🔄 I parametri dovrebbero essere regolati in base agli orizzonti di trading.
- 🌐 L'analisi su più timeframe offre una visione più completa.
📈 Usa l'indicatore ZigZag come uno strumento potente per semplificare l'analisi, identificare le tendenze e migliorare il processo decisionale nel tuo percorso di trading! 🚀
Riepilogo
Key functionalities include:
- Trend Identification: Visualizes primary market direction, highlights bullish and bearish trends, and marks key support and resistance levels.
- Pattern Analysis: Simplifies recognition of chart patterns such as triangles, flags, and Elliott waves.
- Trade Management: Assists in identifying entry and exit points, setting stop-loss levels based on previous pivots, and establishing realistic price targets.
- Volatility Analysis: Reflects market volatility through pivot distances, aiding strategy adjustments and distinguishing consolidation from trending phases.
- Signal Confirmation: Validates breakouts and complements other indicators for robust trading strategies.
The indicator is retrospective, confirming pivots only after price movements occur, and is not predictive on its own. Sensitivity can be adjusted via the deviation percentage to show more or fewer pivot points. It is compatible with any timeframe and benefits from multi-timeframe analysis for comprehensive market views.
This tool supports analysis across various markets including cryptocurrencies (BTCUSD), commodities (XAUUSD), and others, and integrates with related indicators like RSI, ATR, and Supertrend.
Recensioni dei clienti
5 | 50 % | |
4 | 33 % | |
3 | 17 % | |
2 | 0 % | |
1 | 0 % |


