
Descrizione
🎯 INTELLIGENZA DELLA VOLATILITÀ MULTI-TIMEFRAME
Non Perdere Più le Rotture di Volatilità - Vedi Ogni Timeframe Contemporaneamente
La maggior parte degli indicatori di volatilità ti mostra solo una prospettiva. Il nostro Indicatore di Volatilità Mobile Multi-Timeframe ti offre il quadro completo su periodi a breve termine (7), medio termine (21) e lungo termine (63) - con segnali di trading integrati che ti indicano esattamente quando agire.
⚡ PERCHÉ LA VOLATILITÀ MULTI-TIMEFRAME CAMBIA TUTTO
Timeframe Singolo vs Il Nostro Approccio Multi-Timeframe:
- ❌ Periodo Singolo: Vedi gli alberi ma perdi la foresta
- ✅ Tre Periodi: Paesaggio completo della volatilità con contesto
Scenari di Trading Reali:
- Picco a breve termine mentre a lungo termine calma → Rumore temporaneo (ignora)
- Tutti i timeframe in crescita → Cambiamento di regime genuino (agisci)
- Calma a breve termine in mezzo al caos a lungo termine → Falsa calma (prudenza)
🎯 CARATTERISTICHE PROFESSIONALI
✨ VISIBILITÀ TRIPLA TIMEFRAME
- StdDev 7: Cattura cambiamenti immediati di volatilità (intraday)
- StdDev 21: Volatilità a medio termine (swing trading)
- StdDev 63: Contesto di volatilità a lungo termine (position trading)
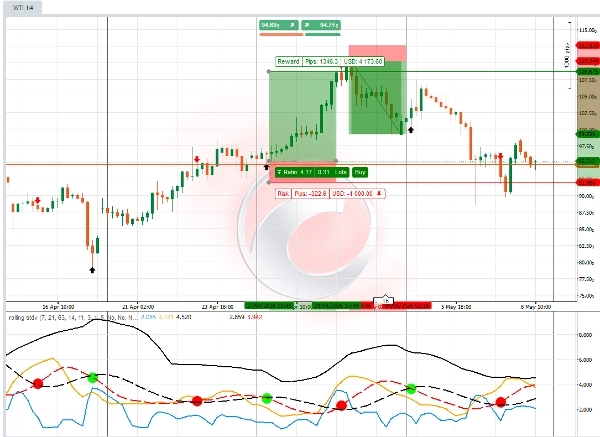
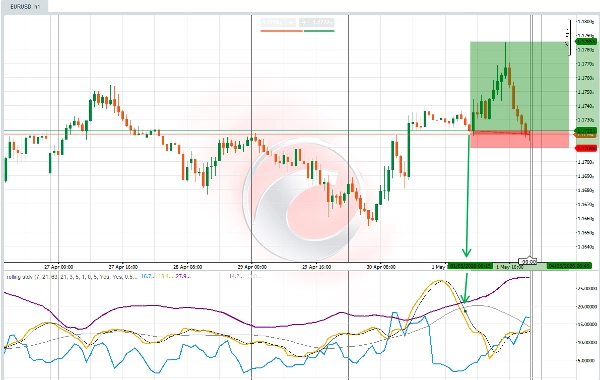
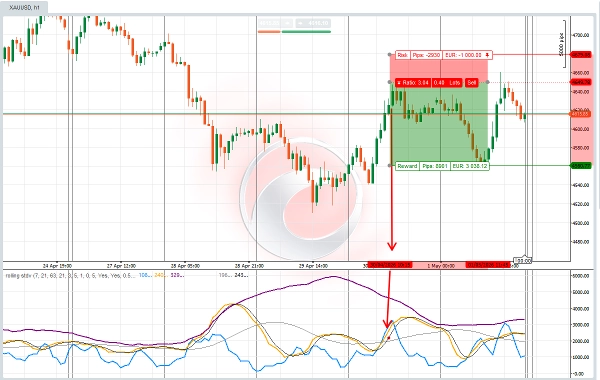
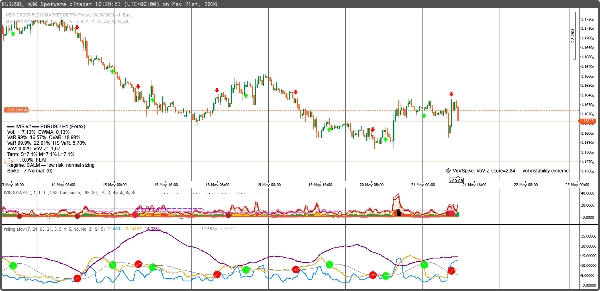
- Segnale oscillatore: quando le linee segnale della deviazione standard mobile media si incrociano, i punti colorati confermano volatilità più alta e più bassa e la direzione dell'azione del prezzo. Con un segnale grande Red-DOT, Green-DOT, il Trader vedrà anche un segnale Red-Arrow, Green-Arrow sul grafico, che può aiutare a decidere i livelli di ingresso e la dimensione della posizione.
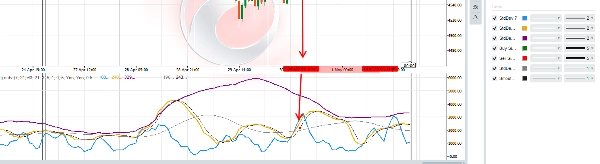
- La deviazione standard mobile è un oscillatore di volatilità con logica di segnale predittiva del mercato. I parametri sul pannello devono essere controllati e adattati al tipo di strumento CFD che il trader vuole negoziare. Ogni strumento CFD di asset finanziari può avere impostazioni leggermente diverse sul pannello. I trader possono scegliere la precisione e l'accuratezza delle letture di volatilità, attivando: Slope, segnale di incrocio Fast/Mid e Smoothing.
📊 ANALISI AVANZATA DELLA VOLATILITÀ
- Incroci di Volatilità: Incrocio delle linee StdDev = cambiamenti di regime
- Segnali di Ritorno alla Media: Volatilità che ritorna alla media
- Rilevamento di Picchi: Eventi di volatilità estrema
💡 PERFETTO PER QUESTI STILI DI TRADING:
🎯 Trader di Rotture di Volatilità
- Entra durante bassa volatilità prima di movimenti esplosivi
- Esci durante alta volatilità prima dei ribaltoni
- Temporizza gli ingressi con precisione usando tripla conferma
📈 Trader di Ritorno alla Media
- Contrasta gli estremi di volatilità con fiducia
- Identifica condizioni di mercato sovraestese
- Usa la volatilità come indicatore contrario
🛡 Trader Avversi al Rischio
- Evita completamente i periodi di alta volatilità
- Opera solo durante mercati calmi e prevedibili
- Usa la volatilità come guida per la dimensione della posizione
📊 Trader di Opzioni
- Vendi il premio temporale durante alta volatilità
- Compra opzioni durante la compressione della volatilità
- Analisi IV vs HV per errori di prezzo
Segnali Intelligenti Integrati:
- ✅ Compra quando: La volatilità scende sotto la soglia O incrocia al di sotto della media mobile
- ✅ Vendi quando: La volatilità supera la soglia O incrocia al di sopra della media mobile
📈 COSA OTTIENI:
✅ Visibilità Tripla Timeframe - Niente più indovinare il contesto di volatilità
✅ Segnali di Acquisto/Vendita Automatici - Frecce visive chiare nei punti ottimali
✅ Rilevamento del Regime di Volatilità - Sapere quando i mercati sono calmi o caotici
✅ Soglie Personalizzabili - Adattati a qualsiasi stile di trading o asset
✅ Codifica Colore Professionale - Comprensione visiva immediata
💰 PREZZO SPECIALE DI LANCIO: $50
(Prezzo normale: $100)
Ripartizione del Valore:
- Indicatore StdDev 7: valore $29
- Indicatore StdDev 21: valore $29
- Indicatore StdDev 63: valore $29
- Segnali di Trading: valore $49
- Valore Totale: $136
- Il Tuo Prezzo: $50 (Risparmia 35%)
Incluso: Indicatore completo Colore
🎁 BONUS: Guida Gratuita al Timing della Volatilità
L'acquisto include "Maestria nella Volatilità Multi-Timeframe" - un valore di $39 GRATIS.
Include:
- Strategie di trading sulla compressione della volatilità
- Tecniche di conferma multi-timeframe
- Gestione del rischio per periodi volatili
- Esempi di trade reali
🚀 PRONTO A DOMINARE IL TIMING DELLA VOLATILITÀ?
Clicca su "Aggiungi al Carrello" e trasforma il modo in cui vedi e fai trading sulla volatilità di mercato.
"Ho provato ogni indicatore di volatilità esistente. Questo approccio a triplo timeframe con segnali integrati è quello che uso quotidianamente nel mio trading per conto di prop firm."
- Sarah Rodriguez, Trader Professionale Swing
PERFETTO PER QUESTI MERCATI:
📊 Azioni & ETF
- Timing della volatilità SPY, QQQ
- Rotazione settoriale basata sulla volatilità
- Operazioni sulla volatilità degli utili
💹 Coppie Forex
- Analisi della volatilità delle coppie principali
- Valutazione del rischio carry trade
- Conferma di breakout
📈 Materie Prime
- Cicli di volatilità dell'oro
- Picchi di volatilità del petrolio
- Volatilità stagionale agricola
🔄 Criptovalute
- Regimi di volatilità BTC/ETH
- Opportunità di volatilità altcoin
- Gestione del rischio nelle crypto
Conclusione: Questo non è solo un altro indicatore di deviazione standard. È un sistema completo di timing della volatilità che ti mostra esattamente quando i mercati stanno per muoversi.
Offerta di Lancio Limitata: Prime 150 copie a $89 (risparmia $30)
"La differenza tra trading amatoriale e professionale spesso si riduce al timing della volatilità. Questo indicatore colma quella lacuna."
Aggiungi al Carrello Ora → Inizia a Fare Trading sulla Volatilità Come un Professionista.
Riepilogo
Key features include:
- Triple timeframe visibility for immediate, swing, and position trading contexts.
- Volatility crossovers signaling regime shifts.
- Mean reversion and spike detection for volatility extremes.
- Customizable parameters to adapt to different CFD instruments and trading styles.
- Professional color-coded signals for quick interpretation.
This indicator suits various trading styles, including volatility breakout, mean reversion, risk-averse, and options trading. It supports multiple markets such as stocks, ETFs, forex pairs, commodities, and cryptocurrencies, providing volatility timing insights for assets like SPY, QQQ, gold, oil, BTC, and ETH.
Included with the indicator is a volatility timing guide covering compression strategies, multi-timeframe confirmation, risk management, and real trade examples. The tool requires tick data and outputs actionable signals to enhance volatility-based trading decisions.
Recensioni dei clienti
5 | 50 % | |
4 | 50 % | |
3 | 0 % | |
2 | 0 % | |
1 | 0 % |


