
Descrizione
VOLUME PROFILE FIXED RANGE — PRO
La maggior parte degli indicatori ti dice dove è andato il prezzo. Il Volume Profile ti dice dove il mercato ha effettivamente negoziato — i livelli in cui acquirenti e venditori hanno impegnato un volume reale. Questi sono i livelli che continuano a fungere da supporto, resistenza e calamite di prezzo molto tempo dopo che il movimento è terminato.
Questo indicatore porta un Volume Profile a intervallo fisso completo e professionale su cTrader: seleziona qualsiasi intervallo sul tuo grafico e vedi istantaneamente la sua struttura di volume, il Punto di Controllo e l'Area di Valore.
🆕 NOVITÀ NELLA VERSIONE 2
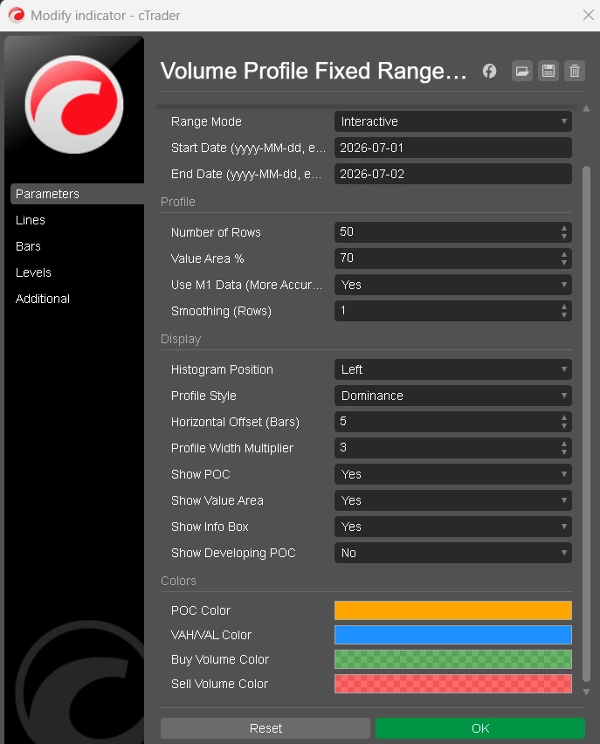
• Selezione intervallo interattiva — trascina l'indicatore sul grafico e semplicemente sposta due linee per impostare il tuo intervallo. Niente digitazioni, niente date, nessuna configurazione.
• Precisione dei dati al minuto — il profilo è costruito da barre M1 anche su grafici H1 o giornalieri, offrendo una distribuzione del volume molto più accurata rispetto alle approssimazioni basate sulle barre.
• Area di Valore standard del settore — VAH e VAL sono ora calcolati con il metodo classico di espansione del Market Profile, così i tuoi livelli corrispondono a quelli che i professionisti vedono su altre piattaforme.
• Istogramma suddiviso Buy/Sell — ogni riga mostra la proporzione di volume di acquisto rispetto a quello di vendita, permettendoti di individuare assorbimenti e squilibri a colpo d'occhio.
• Rendering fluido e istantaneo — il profilo segue lo scorrimento e lo zoom in tempo reale, senza sfarfallii e senza attese per il tick successivo.
• Smussatura regolabile — affina la forma del profilo senza distorcere i livelli chiave.
• POC in sviluppo — linea opzionale che mostra come il Punto di Controllo si è spostato attraverso l'intervallo.
• Gestione dati più intelligente — carica automaticamente la cronologia più vecchia quando il tuo intervallo lo richiede e ti avvisa se i dati disponibili sono incompleti.
• Design consapevole del tema — colori scelti per rimanere leggibili sia su grafici scuri che chiari, più un pannello informativo pulito con intervallo, volume totale, POC, VAH e VAL.
📊 COSA MOSTRA
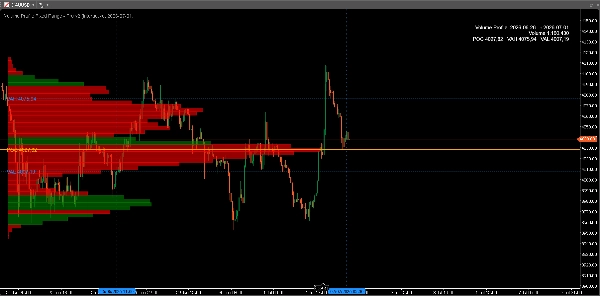
• POC (Punto di Controllo) — il livello di prezzo con il volume più alto negoziato nell'intervallo.
• Area di Valore (VAH / VAL) — la zona che contiene il 70% di tutto il volume (regolabile dal 50% al 95%).
• Istogramma del volume — da 10 a 400 righe di prezzo, colorate in base al predominio buy/sell o suddivise per riga.
• POC in sviluppo — come il prezzo più equo è evoluto nell'intervallo (opzionale).
🎯 COME LO USANO I TRADER
• Reazioni di trading al POC — spesso si comporta come un forte supporto/resistenza e una calamita per la media-ripresa.
• Usa i bordi dell'Area di Valore per definire i confini dell'intervallo e individuare rotture genuine.
• Identifica zone a basso volume dove il prezzo tende a muoversi velocemente — obiettivi naturali e aree di stop.
• Conferma i tuoi livelli chiave con la partecipazione reale del mercato invece che solo con l'azione del prezzo.
⚙️ COMPLETAMENTE REGOLABILE
• Due modalità di intervallo: linee di trascinamento interattive o date di inizio/fine fisse.
• Righe, percentuale dell'Area di Valore, smussatura, lato dell'istogramma, larghezza e offset.
• Due stili di istogramma: suddivisione buy/sell o colore di predominio singolo.
• Ogni colore personalizzabile; POC, Area di Valore, pannello informativo e POC in sviluppo possono essere attivati o disattivati singolarmente.
🔧 PROGETTATO PER L'USO QUOTIDIANO
• Funziona su qualsiasi simbolo e qualsiasi timeframe.
• Impostazioni predefinite sensate — mostra un profilo utilizzabile pochi secondi dopo l'applicazione.
• Leggero ed efficiente: ricalcola solo quando l'intervallo cambia, non a ogni tick.
• Acquisto una tantum. Nessun abbonamento. Aggiornamenti gratuiti.
Se l'analisi del volume fa parte del tuo processo — o vuoi che lo sia — questo ti offre l'intero set di strumenti Fixed Range, costruito nativamente per cTrader.
Riepilogo
Users can interactively select the range by dragging lines on the chart or specify fixed start and end dates. The volume histogram displays buy and sell volume splits per price level, enabling identification of buying/selling pressure and volume imbalances. Additional features include a developing POC line showing how the fair price evolved within the range, adjustable smoothing for profile shape refinement, and a theme-aware design for readability on different chart backgrounds.
The indicator supports full customization of rows, histogram style, colors, and display elements. It automatically loads historical data as needed and recalculates only when the selected range changes, optimizing performance. It is suitable for any symbol and timeframe, providing traders with volume-based support and resistance levels, breakout zones, and areas of low volume that may indicate rapid price movement.
Recensioni dei clienti
5 | 67 % | |
4 | 0 % | |
3 | 33 % | |
2 | 0 % | |
1 | 0 % |


