
Fractals
Indikator
2 käufe
Version 1.0, Aug 2025
Windows, Mac
4.0
Bewertungen: 2
Beschreibung
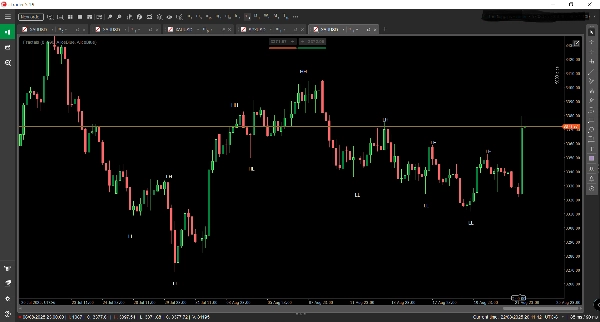
🧠 Fraktale – Marktstruktur visualisiert
Fraktale ist ein präzise entwickelter Trading-Indikator für cTrader, der die verborgene Architektur der Kursbewegungen offenlegt. Durch die automatische Erkennung und Kennzeichnung von Higher Highs (HH), Higher Lows (HL), Lower Highs (LH) und Lower Lows (LL) direkt im Chart verwandelt Fraktale rohe Preisdaten in eine klare, umsetzbare Karte der Marktstruktur.
🔍 Hauptmerkmale:
- Echtzeit-Strukturabbildung: Erkennt sofort Swing-Punkte und kennzeichnet sie, um Trendrichtung und Umkehrzonen sichtbar zu machen.
- Multi-Timeframe-Bewusstsein: Entwickelt, um die Makrostruktur auf höheren Zeitrahmen hervorzuheben und Tradern einen strategischen Vorteil bei der Ausrichtung von Einstiegen an dominanten Trends zu geben.
- Trendfolge-Optimierung: Ideal für Trader, die Momentum-, Ausbruchs- oder Pullback-Strategien verwenden, unterstützt bei der Bestätigung der Marktrichtung und vermeidet Gegen-Trend-Fallen.
- Saubere visuelle Überlagerung: Elegante Chart-Anmerkungen, die sich nahtlos in jedes Trading-Setup integrieren und die Übersichtlichkeit verbessern, ohne zu überladen.
🧭 Anwendungsfälle:
- Erkenne aufkommende Trends und strukturelle Veränderungen, bevor sie offensichtlich sind.
- Validiere Trade-Setups mit struktureller Bestätigung.
- Kombiniere mit gleitenden Durchschnitten, Volumen oder benutzerdefinierten Indikatoren für mehrschichtige Konfluenz.
- Perfekt für manuelles Backtesting und Prop-Firm-Bewertungen, bei denen strukturbasierte Logik entscheidend ist.
Zusammenfassung
KI-Zusammenfassung
Fractals is a trading indicator designed for the cTrader platform that visualizes market structure by automatically detecting and labeling key price action points: Higher Highs (HH), Higher Lows (HL), Lower Highs (LH), and Lower Lows (LL). It provides real-time mapping of swing points to reveal trend direction and potential reversal zones. The indicator supports multi-timeframe analysis, emphasizing macro structure on higher timeframes to help align trades with dominant market trends. Fractals is optimized for momentum, breakout, and pullback strategies, assisting traders in confirming bias and avoiding counter-trend trades. Its clean visual overlay integrates smoothly with existing chart setups, enhancing clarity without clutter. Use cases include spotting emerging trends and structural shifts early, validating trade setups with structural confirmation, combining with other indicators like moving averages or volume for layered analysis, and supporting manual backtesting and prop firm evaluations where market structure is critical. The indicator applies across various markets including Forex, indices, commodities, cryptocurrencies, and stocks.
Indikatorprofil
Kundenbewertungen
4.0
Bewertungen: 2
5 | 0 % | |
4 | 100 % | |
3 | 0 % | |
2 | 0 % | |
1 | 0 % |
Kundenbewertungen
August 31, 2025
it gives the trade idea another check, but the result needs a journal.
August 27, 2025
Diskussion
Häufig gestellte Fragen (FAQ)
Prop
Forex
Indices
Commodities
Crypto
Stocks
Über den cTrader Store verfügbare Produkte, einschließlich Handelsbots, Indikatoren und Plugins, werden von externen Entwicklern bereitgestellt und nur zu Informations- und technischen Zugriffszwecken verfügbar gemacht. cTrader Store ist kein Broker und erbringt keine Anlageberatung, persönlichen Empfehlungen oder eine Garantie für zukünftige Performance.


![„High-Low Divergence [Iridio Capital]“-Logo](https://cdn.ctrader.com/image/webp/443c4661-7abb-40f1-842f-4b6ec560649b_40914)


Preis
26
Verkäufe
2.18K
Kostenlose Installationen