Indikator
Breakout
AI
Scalping
KaufmanEfficiencyRatio
„KaufmanEfficiencyRatio“-Logo
13/09/2025
7
Desktop
Since 08/08/2025
Verkäufe
2
Free installs
246
In „KaufmanEfficiencyRatio“ hochgeladenes Bild

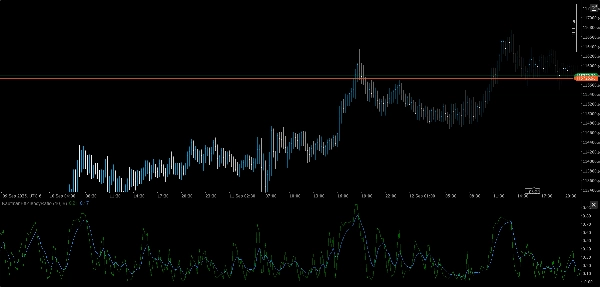
⚡ Kaufman Efficiency Ratio (KER)

Trend clarity, quantified.

The Kaufman Efficiency Ratio (KER) is a precision tool for measuring how efficiently price moves from point A to B—without getting lost in the noise. Whether you're validating breakout conditions or filtering sideways chop, KER gives you a clean score between 0 and 1 that reflects directional intent versus volatility.

🔍 What It Does

  • Calculates Kaufman’s Efficiency Ratio:
  • Outputs a normalized value from 0 (pure noise) to 1 (perfect trend)
  • Highlights trending vs. non-trending regimes with zero ambiguity
  • Ideal for adaptive overlays, regime filters, and signal gating

🛠️ Key Features

  • Modular input manager for multi-timeframe sourcing
  • Cross-asset compatible: FX, crypto, indices, equities
  • Lightweight, real-time logic with no smoothing lag
  • Plug-and-play with your existing suite architecture

🎯 Use Cases

  • Trend Validation: Confirm directional bias before signal execution
  • Noise Filtering: Suppress entries during inefficient price action
  • Regime Detection: Pair with volatility-aware overlays for smarter transitions
  • Strategy Building: Use as a core metric in breakout, momentum, or bias logic

💡 Bonus

KER is free, fast, and ruthlessly efficient—just like your code. No fluff, no filters. Just raw market intent, distilled.


Mehr von diesem Autor
FVG
The Indicator is a powerful tool for price-action traders seeking to identify and exploit short-term imbalances.
Indikator
Indices
Prop
Stocks
+3
Fractals
Fractals is a precision-engineered trading indicator for cTrader that reveals the hidden architecture of price action.
pATR
An indicator that redefines ATR by applying a percentile-based filter giving traders a grounded view of volatility.
Indikator
Indices
Prop
Stocks
+3
Smooth Heiken Ashi
The Smooth Heiken Ashi indicator is a refined charting tool designed to filter out market noise and highlight true price
Indikator
NAS100
Indices
XAUUSD
+4
PrevDayProjection
Automatically calculates the previous day’s high and low, determines the range, and then projects Fibonacci levels.
Indikator
Indices
Breakout
Prop
+8
MarketRegimeAI
A cutting‑edge trading indicator that fuses AI and mathematics with adaptive logic to classify market regimes.
Indikator
Grid
NAS100
XAUUSD
+6
AutoFibRetracement
A powerful overlay tool designed to automatically plot Fibonacci retracement levels based on a custom window.
cBot
XAUUSD
Breakout
ORB2
A high-performance cBot engineered to capture explosive moves in the gold market using the proven Opening Range Breakout
DEnvelopSystem
DEnvelop is a high-performance trading indicator engineered for scalpers and intraday strategists who demand precision.
Indikator
Indices
Prop
Commodities
+3
OBScope
A cutting-edge indicator designed to detect and visualize high-probability zones based on swing highs, swing lows.
Indikator
Indices
Commodities
Stocks
+2
MARainbow
MARainbow gives you the edge with four customizable moving averages—each color-coded for instant recognition.
Indikator
Indices
Prop
Breakout
+3
RVI
A precision-crafted indicator that compares current volume to its historical average for the same time of day.
Indikator
Indices
XAUUSD
Breakout
+3
AnchoredVWAP
A precision overlay tool that combines session-aware VWAP logic and standard deviations.
Das könnte Sie auch noch interessieren
TrendStrengthSignals
Edge-aware clouds + Pro HUD: better entries, calmer exits, adaptive risk.
Indikator
NAS100
RSI
NZDUSD
+15
HAIQuantum_TheGame
This trading game allows you to explore and practice investment strategies in a real-time market data environment.
Indikator
Signal
TendSignal_indicator
Trend following signal
Daily Sessions HighLow Helper
Shows daily and sessions highs / lows and session boxes, everything configurable
ICT MACRO THEORY
Are essentially short intervals during which the algorithm seeks liquidity or adjusts price.....
Supply Demand - BasicV1
Supply and demand zones. They're important. Here's a free version to get you started!
Indikator
RSI
Breakout
Supertrend
+3
Fibonacci Linear Regression Multi-timeframe
Combining Fibonacci levels and regression to analyze multidimensional market trends across multiple timeframes¡
Indikator
VWAP
ZigZag
RSI
+6
RSI T3 Overbought and oversold areas
Three parameter RSI
Indikator
RSI
Breakout
XAUUSD
+6
Multi-Asset Performance Matrix
Visual tool tracking financial assets' % performance across timeframes, highlighting trends with color-coded insights.
Beste Ratings
Kostenlos
VWAP Pro
Advanced VWAP with up to 30 anchored levels, multiple timeframes, memory mode, standard deviation bands & simple GUI
Indikator
NAS100
NZDUSD
XAUUSD
+11
Samurai Breakout Lite
⚔️Limited version. Draws clean session box (Tokyo / London / New York / Overlap) and optional breakout plan (EP/TP/SL)⚔️
Indikator
NAS100
NZDUSD
XAUUSD
+11
RT Consolidation Zones
Identify and trade breakouts with Consolidation Zones! Visualize price consolidation areas for trading opportunities.
Indikator
NAS100
NZDUSD
Breakout
+11
Previous day Key Levels
Previous day key levels indicator
Indikator
Indices
RSI
XAUUSD
+5
cAlgoBuddy - Composite Index RSI
What Constance Brown did with the RSI was to input a momentum calculation within the RSI itself. This the Composite RSI.
Indikator
Breakout
PDHL
PDHL - Previous Day High&Low
Fisher_m11
Fisher Transform with smoothing. Spot reversals and cycles with precision. Great for any market, any timeframe.
Indikator
RSI
Breakout
XAUUSD
+4
Dynamic Market Structure Analysis of Turning Points
Identify market structure effortlessly with swing highs, lows, CHoCH, and BOS levels for smart trading decisions! 📊🔍"