
FVG
Wskaźnik
1.07K pobrania
Wersja 1.1, Dec 2025
Windows, Mac
Opis
🧠 Wskaźnik Fair Value Gap (FVG)
Precyzyjnie ujawnij ukryte nierównowagi rynkowe
Wskaźnik Fair Value Gap (FVG) to potężne narzędzie dla traderów price-action, którzy chcą identyfikować i wykorzystywać krótkoterminowe nieefektywności spowodowane agresywnym przepływem zleceń instytucjonalnych. Opierając się na solidnej logice 3 świec, automatycznie wykrywa strefy FVG bycze i niedźwiedzie — obszary, do których cena może powrócić, zanim kontynuuje swój trend.
🔍 Kluczowe cechy
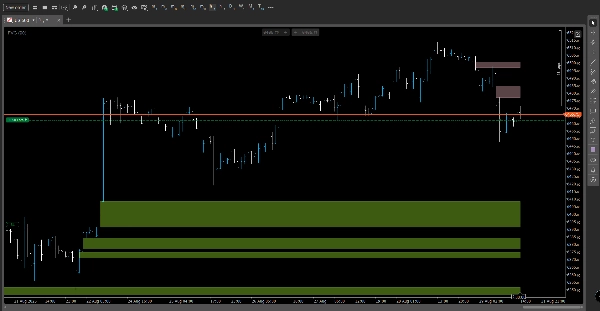
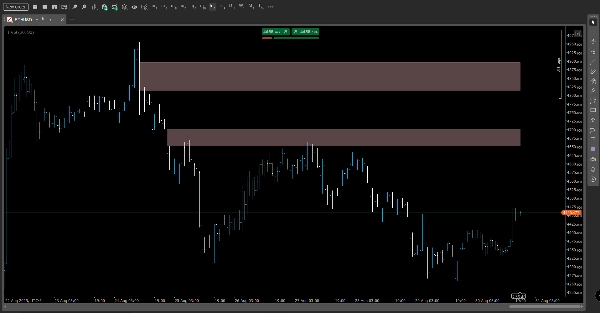
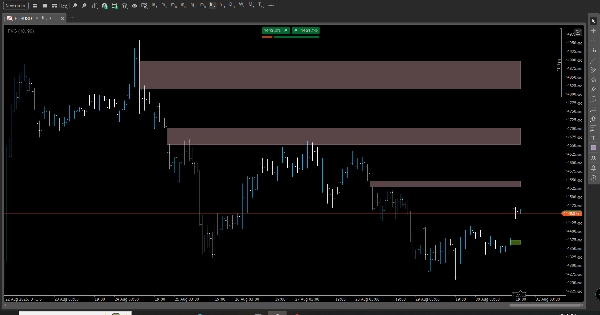
- Automatyczne wykrywanie FVG: Podkreśla strefy nierównowagi za pomocą czystych, nieprzemalowujących się prostokątów opartych na lukach między świecami.
- Śledzenie likwidacji: Monitoruje moment, gdy cena powraca i wypełnia lukę, aktualizując wizualizacje i rejestrując zdarzenia likwidacji.
- Nakładka stref nielikwidowanych: Wyświetla aktywne FVG jako pogrubione linie poziome dla szybkiego odniesienia i planowania transakcji.
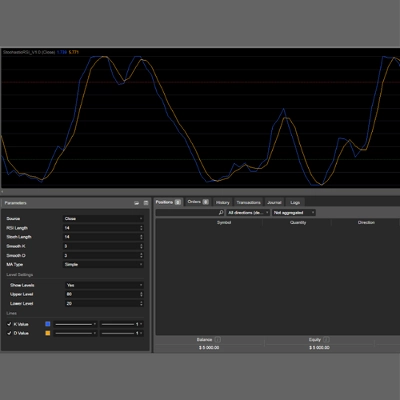
- Adaptacyjne progowanie: Wybierz tryb progowania ręcznego lub automatycznego, aby dostosować czułość na rynkach zmiennych lub spokojnych.
- Własne wizualizacje: Skonfiguruj kolory, przezroczystość i długość projekcji, aby dopasować je do swojego stylu wykresów.
- Rejestracja w terminalu: Zwięzłe logi raportują łączną liczbę luk, likwidacji i aktywnych stref — idealne do weryfikacji strategii.
🎯 Korzyści
- Jasne odniesienia do transakcji: Używaj stref FVG jako celów powrotu, obszarów reakcji lub punktów zbieżności z innymi koncepcjami smart money.
- Niski ślad wizualny: Czysty design utrzymuje czytelność wykresów, zachowując jednocześnie istotny kontekst nierównowagi.
- Niezawodne testy historyczne: Logika zamkniętych świec zapewnia stabilne sygnały bez przemalowywania.
- Gotowy na wiele interwałów czasowych: Idealny dla skalperów, traderów swingowych i analityków w stylu instytucjonalnym.
👤 Dla kogo jest to przeznaczone
- Traderzy Smart Money & ICT
- Purystyczni traderzy price action
- Analitycy ilościowi weryfikujący reakcje przepływu zleceń
- Traderzy poszukujący wysokoprawdopodobnych wejść opartych na strukturze rynku
Podsumowanie
Podsumowanie AI
The Fair Value Gap (FVG) Indicator is designed for price-action traders to identify short-term market imbalances caused by institutional order flow. It uses a 3-bar logic to automatically detect bullish and bearish FVG zones—price gaps where the market may return before continuing its trend. Key features include automated detection with non-repainting rectangles, mitigation tracking that updates when gaps are filled, and an overlay of active unmitigated zones for easy reference. Users can adjust sensitivity via manual or automatic threshold modes and customize visual elements such as colors and opacity. The indicator logs gap statistics and mitigation events in the terminal for strategy validation. It supports multi-timeframe analysis, making it suitable for scalpers, swing traders, and institutional-style analysts. The FVG Indicator provides clear trade reference points, a low visual footprint to maintain chart readability, and reliable backtesting signals based on closed-bar logic. It is intended for traders focused on smart money concepts, price action, and order-flow validation seeking high-probability entries aligned with market structure.
Profil wskaźnika
Opinie klientów
0.0
Opinie: 0
Opinie klientów
Ten produkt nie ma jeszcze opinii. Wypróbowałeś(-aś) go już? Bądź pierwszy(-a) i powiedz o tym innym!
Dyskusja
Częste pytania
Produkty dostępne za pośrednictwem cTrader Store, w tym boty handlowe, wskaźniki i wtyczki, dostarczane są przez deweloperów zewnętrznych i udostępniane wyłącznie w celach informacyjnych oraz w celu zapewnienia dostępu technicznego. cTrader Store nie jest brokerem i nie zapewnia doradztwa inwestycyjnego, nie udziela spersonalizowanych rekomendacji ani nie gwarantuje przyszłych wyników.


Cena
26
Sprzedaż
2.14K
Bezpłatne instalacje