
Fractals
Wskaźnik
2 zakupy
Wersja 1.0, Aug 2025
Windows, Mac
4.0
Opinie: 2
Opis
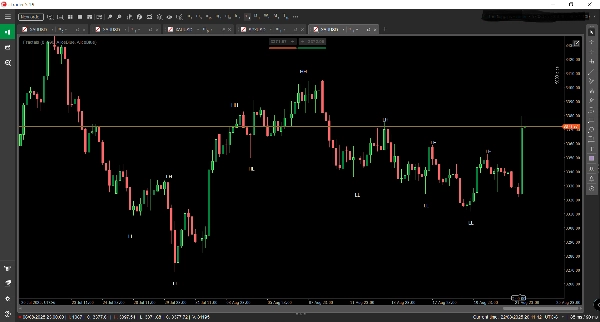
🧠 Fraktale – Wizualizacja Struktury Rynku
Fraktale to precyzyjny wskaźnik handlowy dla cTrader, który ujawnia ukrytą architekturę ruchu cen. Poprzez automatyczne wykrywanie i oznaczanie Wyższych Szczytów (HH), Wyższych Dołków (HL), Niższych Szczytów (LH) oraz Niższych Dołków (LL) bezpośrednio na wykresie, Fraktale przekształca surowe dane cenowe w jasną, praktyczną mapę struktury rynku.
🔍 Kluczowe Funkcje:
- Mapowanie Struktury w Czasie Rzeczywistym: Natychmiast identyfikuje punkty zwrotne i oznacza je, aby ujawnić kierunek trendu oraz strefy odwrócenia.
- Świadomość Wielu Interwałów Czasowych: Zaprojektowany, aby podkreślać strukturę makro na wyższych interwałach, dając traderom strategiczną przewagę w dopasowywaniu wejść do dominujących trendów.
- Optymalizacja Podążania za Trendem: Idealny dla traderów stosujących strategie momentum, wybicia lub cofnięcia, pomagając potwierdzić nastawienie i unikać pułapek przeciwtrendowych.
- Czysta Nakładka Wizualna: Eleganckie adnotacje na wykresie, które integrują się bezproblemowo z każdym układem handlowym, zwiększając przejrzystość bez bałaganu.
🧭 Zastosowania:
- Wykrywaj pojawiające się trendy i zmiany strukturalne zanim staną się oczywiste.
- Weryfikuj ustawienia transakcji za pomocą potwierdzenia strukturalnego.
- Łącz z średnimi kroczącymi, wolumenem lub niestandardowymi wskaźnikami dla wielowarstwowej konfluencji.
- Idealny do ręcznego testowania wstecznego oraz ocen firm prop, gdzie logika oparta na strukturze jest kluczowa.
Podsumowanie
Podsumowanie AI
Fractals is a trading indicator designed for the cTrader platform that visualizes market structure by automatically detecting and labeling key price action points: Higher Highs (HH), Higher Lows (HL), Lower Highs (LH), and Lower Lows (LL). It provides real-time mapping of swing points to reveal trend direction and potential reversal zones. The indicator supports multi-timeframe analysis, emphasizing macro structure on higher timeframes to help align trades with dominant market trends. Fractals is optimized for momentum, breakout, and pullback strategies, assisting traders in confirming bias and avoiding counter-trend trades. Its clean visual overlay integrates smoothly with existing chart setups, enhancing clarity without clutter. Use cases include spotting emerging trends and structural shifts early, validating trade setups with structural confirmation, combining with other indicators like moving averages or volume for layered analysis, and supporting manual backtesting and prop firm evaluations where market structure is critical. The indicator applies across various markets including Forex, indices, commodities, cryptocurrencies, and stocks.
Profil wskaźnika
Opinie klientów
4.0
Opinie: 2
5 | 0 % | |
4 | 100 % | |
3 | 0 % | |
2 | 0 % | |
1 | 0 % |
Opinie klientów
August 31, 2025
it gives the trade idea another check, but the result needs a journal.
August 27, 2025
Dyskusja
Częste pytania
Prop
Forex
Indices
Commodities
Crypto
Stocks
Produkty dostępne za pośrednictwem cTrader Store, w tym boty handlowe, wskaźniki i wtyczki, dostarczane są przez deweloperów zewnętrznych i udostępniane wyłącznie w celach informacyjnych oraz w celu zapewnienia dostępu technicznego. cTrader Store nie jest brokerem i nie zapewnia doradztwa inwestycyjnego, nie udziela spersonalizowanych rekomendacji ani nie gwarantuje przyszłych wyników.


Cena
26
Sprzedaż
2.18K
Bezpłatne instalacje