
Açıklama
Grafik Analizinizi Devrimleştirin
Teknik analizin geleceğine adım atın Delta-RSI Candle Pro – sıradan mumları güçlü momentum görselleştiricilere dönüştüren yenilikçi gösterge. Ekranınızı birden fazla göstergeyle neden kalabalıklaştırasınız ki, ihtiyacınız olan her şey mumların üzerinde değil mi?
Hepsi Bir Arada Görsel Ticaret Çözümü
-
- Anında Sinyal Tanıma: Renklerle sezgisel olarak gösterilen momentum gücü ve yönü
- Ekran Alanını Maksimize Edin: Ayrı osilatör panellerini sonsuza dek kaldırın
- Matematiksel Hassasiyet: Gelişmiş polinom regresyon gerçek RSI momentumunu hesaplar
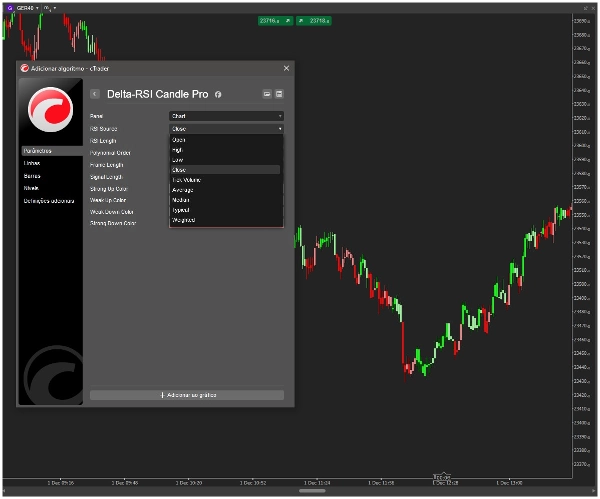
- Tam Özelleştirme: Ticaret stilinize uyacak şekilde cTrader'ın yerel renk seçicilerini kullanın
- Güvenilir ve Doğru: Onaylanmış fiyat verilerine dayalı yeniden boyanmayan hesaplamalar
Delta-RSI Candle Pro Nasıl Çalışır
Özel algoritmamız RSI'nin anlık türevini polinom eğri uydurma yöntemiyle hesaplar, ardından her muma akıllı renkler atar:
-
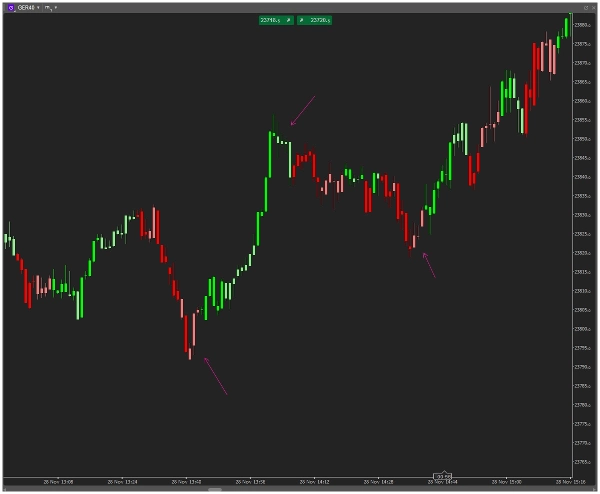
- Güçlü Boğa: Yoğun yeşil – Pozitif momentum hızlanıyor
- Hafif Boğa: Açık yeşil – Pozitif momentum ama dikkatli olunmalı
- Hafif Ayı: Açık kırmızı – Negatif momentum ama potansiyel dönüş
- Güçlü Ayı: Koyu kırmızı – Negatif momentum hızlanıyor
Bizi Farklı Kılan Temel Özellikler
-
- 🎯 Doğrudan Mum Entegrasyonu: Renkler doğrudan ticaret mumlarınızda görünür
- 🎨 Görsel Renk Seçimi: Sezgisel cTrader renk seçicileri – kod isimlerine gerek yok
- ⚙️ Tam Ayarlanabilir: RSI uzunluğu, polinom derecesi ve geriye dönük dönem ayarlarını ince ayarlayın
- 🚀 Optimize Edilmiş Performans: Sorunsuz çalışma için hafif hesaplama motoru
- 📊 Profesyonel Seviyede Algoritma: Üstün sinyaller için matematiksel türev analizi
En Çok Kimler Faydalanır?
-
- Günlük Traderlar anında görsel momentum ipuçlarına ihtiyaç duyanlar
- Swing Traderlar trend değişikliklerini erken tespit edenler
- Minimalist Traderlar grafik kalabalığından nefret edenler
- Algoritmik Traderlar görsel onay arayanlar
- Tüm Ciddi Traderlar piyasa analizinde avantaj isteyenler
Saniyeler İçinde Başlayın
-
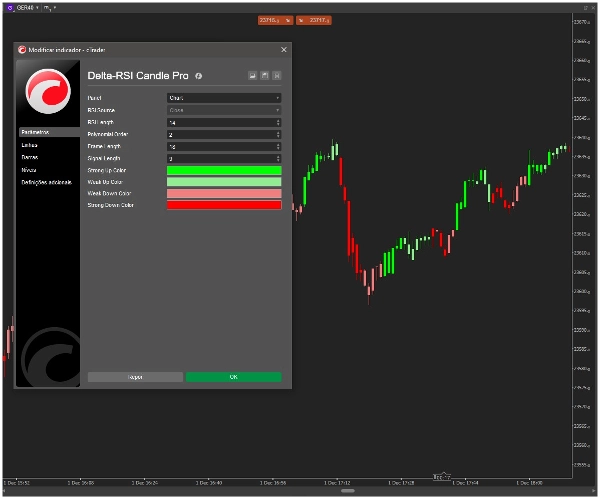
- Delta-RSI Candle Pro'yu grafiğinize ekleyin
- Tercih ettiğiniz renkleri görsel seçicilerle seçin
- Parametreleri ticaret zaman diliminize göre ayarlayın
- Momentum desenlerinin mumlarınızda hemen ortaya çıktığını görün
Teknik Mükemmellik
-
- Üst üste binen gösterge türü (ayrı panel yok)
- Yeniden boyanmayan algoritma
- RSI'nin polinom türev hesaplaması
- Tüm semboller ve zaman dilimleri ile uyumlu
- Düzenli güncellemeler ve iyileştirmeler
Neden Bu Farklı?
Diğer göstergeler karmaşıklık eklerken, Delta-RSI Candle Pro basitleştirir ve geliştirir. Gelişmiş matematiksel momentum analizini görsel olarak sezgisel hale getirdik. Artık fiyat ve göstergeler arasında dikkat bölmek yok – şimdi hepsi uyumlu bir sistem olarak çalışıyor.
Grafiklerinizi devrim niteliğinde yeni bir şekilde görmeye hazır mısınız?...
Özet
Key features include immediate visual signal recognition through candle coloring, elimination of separate oscillator panels to maximize chart space, and advanced mathematical precision with non-repainting calculations based on confirmed price data. Users can fully customize colors and parameters such as RSI length, polynomial order, and lookback period using cTrader’s native color pickers.
Delta-RSI Candle Pro is compatible with all symbols and timeframes and is optimized for smooth performance with a lightweight calculation engine. It is suitable for day traders, swing traders, minimalist traders, algorithmic traders, and others seeking clear, integrated momentum analysis without chart clutter. The indicator overlays directly on price candles, providing a cohesive system that combines price and momentum information visually.
Müşteri değerlendirmeleri
5 | 100 % | |
4 | 0 % | |
3 | 0 % | |
2 | 0 % | |
1 | 0 % |


!["Gaussian Channel [Iridio Capital]" logosu](https://cdn.ctrader.com/image/webp/7c039209-5573-4a54-a072-f9528b503103_41960)


