
Açıklama
cTrader için dinamik bir Fibonacci kanal göstergesi arıyorsanız, başka yere bakmayın. Bu gösterge, seçtiğiniz hareketli ortalamaya paralel olarak otomatik şekilde Fibonacci bantları çizer. Kullanıcı dostudur ve diğer göstergelerim gibi Pop-up, Ses, E-posta ve Telegram mesajları yoluyla uyarılar sağlar. Ayrıca, Bantları, Fibonacci seviyelerini ve Uyarıları özelleştirme esnekliğine sahipsiniz.
İşte özelliklerinin listesi:
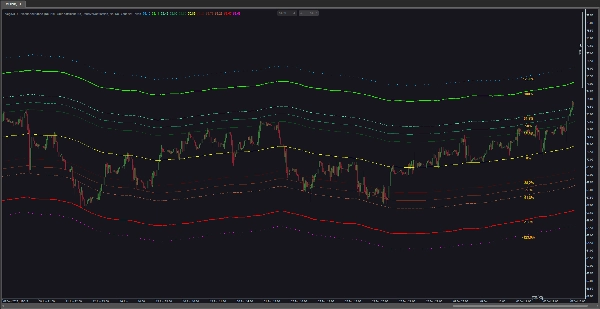
- Fibonacci Bantları Hesaplama: Gösterge, seçtiğiniz hareketli ortalamaya dayalı olarak Fibonacci bantlarını hesaplar ve çizer. Bu bantlar, Fibonacci seviyelerinden (örneğin, %0,0, %38,2, %61,8 veya diğerleri) türetilir ve hareketli ortalamanın üstünde ve altında belirli bir faktörle genişletilir.
- Hareketli Ortalama Yapılandırması: Hesaplamada kullanılan hareketli ortalama türünü (örneğin, Basit, Üssel vb.) ve dönem sayısını özelleştirin. Hareketli ortalama, Fibonacci bantlarının temelini oluşturur.
- Uyarı İşlevselliği: Gösterge, belirli olaylar hakkında traderları bilgilendirmek için çeşitli uyarı seçenekleri sunar. Buna fiyat seviyesi dokunma uyarıları ve yakınlık uyarıları dahildir.
- Fiyat Seviyesi Dokunma Uyarıları: Göstergeyi, fiyat belirli Fibonacci seviyelerine dokunduğunda uyarı vermesi için yapılandırın. Uyarılar, kapanış fiyatına veya fiyat seviyeye dokunduğu anda tetiklenebilir.
- Yakınlık Uyarıları: Fiyat belirli bir Fibonacci seviyesine tanımlı bir mesafe içinde yaklaştığında veya uzaklaştığında bildirim almak için yakınlık uyarıları kurun. Uyarılar, fiyat seviyeye yaklaşırken veya uzaklaşırken tetiklenebilir.
- Uyarı Çıkış Seçenekleri: Uyarılar için sesli uyarılar, pop-up'lar, Telegram mesajları ve e-posta bildirimleri arasından seçim yapın. Sesli uyarılar, farklı ses dosyaları seçilerek özelleştirilebilir.
- Görselleştirme Seçenekleri: Fibonacci seviyelerinin görselleştirmesini, yüzde değerlerini gösterme, yüzde etiketleri için renk ayarlama, etiket konumunu kontrol etme, belirli bantları etkinleştirme/devre dışı bırakma ve bantların renk, kalınlık ve görünümünü seçme gibi seçeneklerle özelleştirin.
- Yapılandırılabilir Fibonacci Seviyeleri: Hesaplamada kullanılan belirli Fibonacci seviyelerini ayarlayarak göstergenizi ticaret stratejinize göre uyarlayın. Pozitif ve negatif Fibonacci seviyeleri ayrı ayrı özelleştirilebilir.
- Dahili Kullanıcı Kılavuzu: Bu göstergenin kullanıcı kılavuzuna doğrudan grafik üzerinden erişebilirsiniz.
Özetle, VegaXLR - Fibonacci Bantları göstergesi, potansiyel destek ve direnç seviyelerini belirlemeye yardımcı olmak için Fibonacci analizini ve hareketli ortalamaları birleştirir. Yapılandırılabilir uyarı işlevselliği ve görselleştirme seçenekleriyle, Fibonacci düzeltmeleri veya genişlemelerine güvenen traderlar için vazgeçilmez bir araçtır.
Özet
Müşteri değerlendirmeleri
5 | 100 % | |
4 | 0 % | |
3 | 0 % | |
2 | 0 % | |
1 | 0 % |


!["[CB] Pivot Points Pro" logosu](https://cdn.ctrader.com/image/webp/43463c82-67b0-4f10-a4ba-901bba091d81_32594)


