
Weekly Daily Levels
Gösterge
2 satın almalar
Sürüm 1.0, Aug 2025
Windows, Mac
5.0
Değerlendirmeler: 2
Açıklama
Ticaret stratejinizde günlük ve haftalık OHLC ve orta nokta fiyatlarına mı güveniyorsunuz? Her işlem yaptığınızda bunları manuel olarak işaretlemekten bıktınız mı?
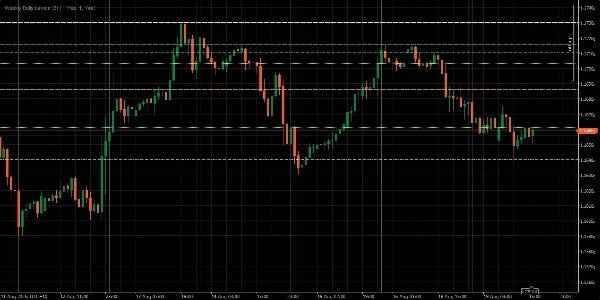
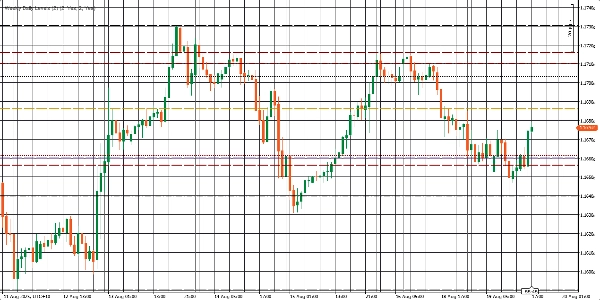
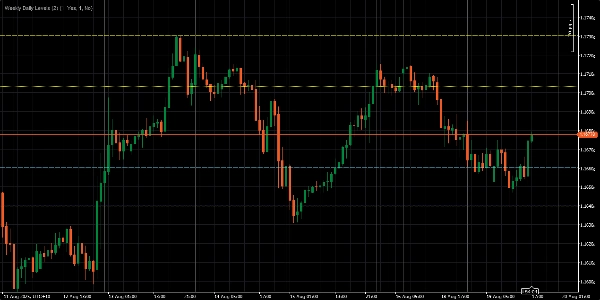
The Weekly Daily Levels Indicator sizin için ağır yükü üstlenir. Önceki günün ve önceki haftanın açılış, en yüksek, en düşük, kapanış (OHLC) ve orta nokta fiyatlarını otomatik olarak doğrudan grafiğinizde çizer. Bu, stratejinizi uygulamaya odaklanabileceğiniz anlamına gelirken, gösterge detaylarla ilgilenir—ticaretinizi daha basit, hızlı ve çok daha verimli hale getirir.
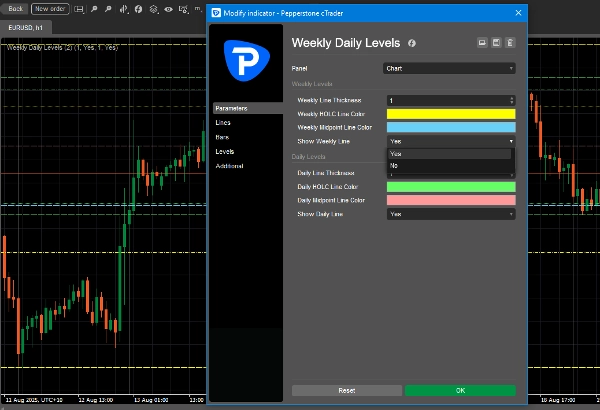
Ana Özellikler:
- Günlük ve haftalık OHLC ve orta nokta fiyatlarını anında gösterir.
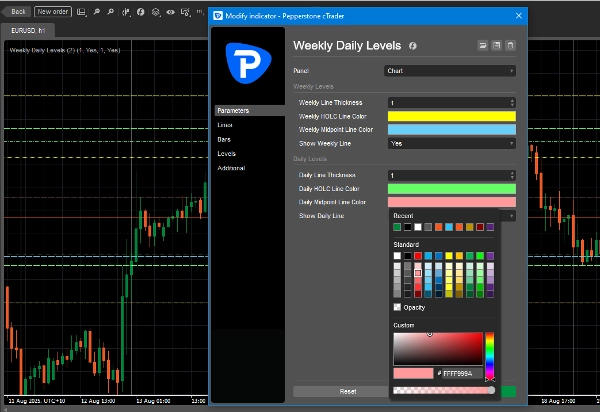
- Çizgi renklerini grafik stilinize uyacak şekilde özelleştirin.
- Günlük veya haftalık seviyeleri tek tıklamayla açıp kapatın.
- Daha iyi görünürlük için çizgi kalınlığını ayarlayın.
Özet
YZ özeti
The Weekly Daily Levels indicator automatically plots the previous day’s and previous week’s open, high, low, close (OHLC) prices along with their mid-points directly on trading charts. It provides instant visual reference to these key price levels, helping traders incorporate daily and weekly price data into their strategies without manual marking. Users can customize line colors and thickness to fit their chart style and toggle daily or weekly levels on or off with a single click. This indicator streamlines the process of tracking important historical price levels for improved trading efficiency.
Gösterge profili
Müşteri değerlendirmeleri
5.0
Değerlendirmeler: 2
5 | 100 % | |
4 | 0 % | |
3 | 0 % | |
2 | 0 % | |
1 | 0 % |
Müşteri değerlendirmeleri
August 28, 2025
Not bad if the rules are already clear. Two timeframes give more context.
August 21, 2025
the good surprise is the setup needs less second guessing, and It works better with a written plan.
Tartışma
SSS
cTrader Store üzerinden erişilebilen işlem botları, göstergeler ve eklentiler gibi ürünler, üçüncü taraf sağlayıcılar tarafından sağlanır ve yalnızca bilgilendirme ve teknik erişim amaçlarıyla sunulur. cTrader Store bir broker değildir ve yatırım tavsiyesi, kişisel öneriler vermez veya gelecekteki performansı garanti etmez.


Fiyat
Başlangıç 19/04/2025
2
Satışlar