
VIX - volatility indicator
Indikator
2 pembelian
Versi 1.2, Apr 2026
Windows, Mac
4.5
Ulasan: 2
Deskripsi
Indikator VIX kepemilikan ini, didukung oleh Average True Range (ATR), memberikan analisis volatilitas pasar yang tepat dan bersih, dioptimalkan untuk cTrader 5.5.13+. Ini menggabungkan pergerakan VIX yang diskalakan dengan analisis volume untuk mengonfirmasi pergeseran besar dan potensi breakout.
Fitur Utama & Kualitas Kode
- Nol Bug/Peringatan: Sepenuhnya direfaktor ke API cTrader terbaru, menghilangkan semua kesalahan dan peringatan lama untuk stabilitas dan performa maksimal.
- VIX Berbasis ATR: Menyediakan ukuran responsif terhadap volatilitas, dinormalisasi untuk kondisi pasar ekstrem saat ini.
- Konfirmasi Ganda: Menggunakan volatilitas (garis VIX) yang dikombinasikan dengan data Volume Tick untuk memvalidasi peringatan breakout dengan probabilitas tinggi.
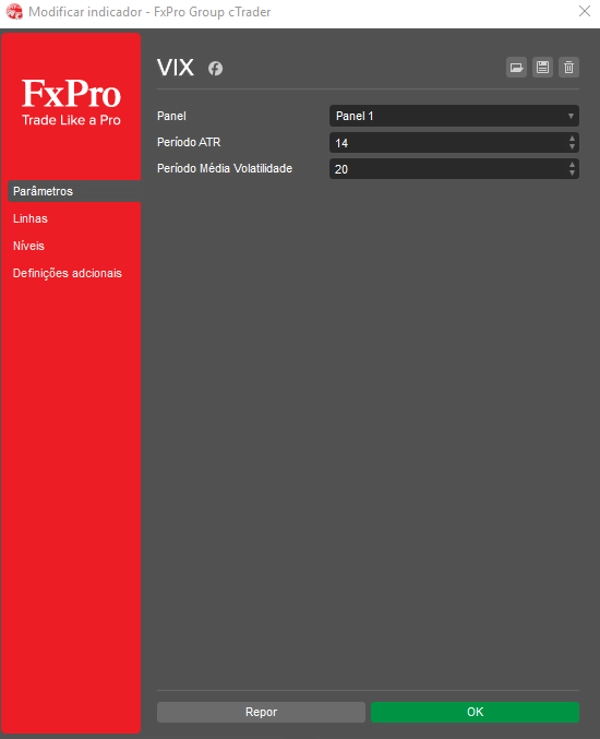
Sesuaikan Pengaturan Anda untuk Wawasan Maksimal
Dengan mudah sesuaikan indikator agar sesuai dengan strategi trading Anda dengan mengatur nilai yang diinginkan untuk Level VIX Rendah dan Level VIX Tinggi. Selain itu, sesuaikan Faktor Skala VIX untuk mengontrol secara tepat tinggi dan visualisasi garis VIX di panel bawah.
Cara Membaca Sinyal Breakout & Konsolidasi
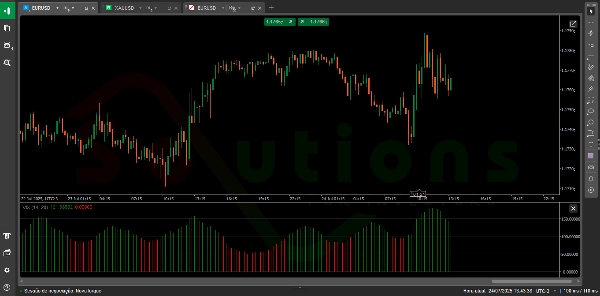
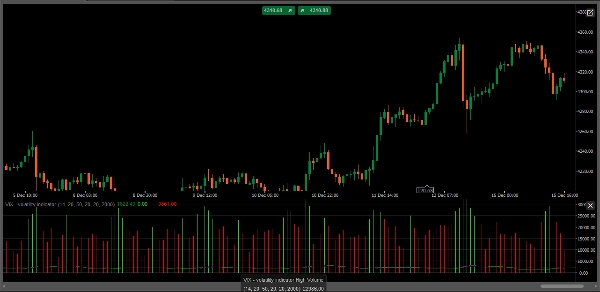
- Peringatan Breakout (Volatilitas Tinggi): Ketika garis VIX menembus kuat di atas Level VIX Tinggi DAN disertai dengan volume tinggi (ditunjukkan oleh histogram Volume Tinggi), ini mengonfirmasi ketakutan/ketamakan ekstrem dan menandakan breakout pasar dengan probabilitas tinggi.
- Sinyal Konsolidasi (Volatilitas Rendah): Ketika garis VIX turun di bawah Level VIX Rendah, ini sering menunjukkan periode ketenangan pasar, konsolidasi ketat, atau potensi mean-reversion — ideal untuk mempersiapkan langkah Anda berikutnya atau mengurangi risiko.
- Wawasan Volume: Indikator ini memplot histogram Volume Tinggi (Hijau) dan Volume Rendah (Merah) di latar belakang, memungkinkan Anda langsung menilai likuiditas dan keyakinan di balik aksi harga saat ini.
Ringkasan
Ringkasan AI
The VIX - Volatility Indicator is a proprietary tool designed for the cTrader platform (version 5.5.13 and above) that measures market volatility using an Average True Range (ATR)-based approach. It combines a scaled VIX line with tick volume data to provide dual confirmation of market conditions, helping traders identify potential breakouts and consolidation phases.
Key features include:
- ATR-based VIX calculation for responsive volatility measurement normalized to detect extreme market conditions.
- Volume analysis with high (green) and low (red) volume histograms to assess liquidity and conviction behind price movements.
- Customizable parameters allowing users to set Low VIX Level and High VIX Level thresholds, as well as adjust the VIX Scale Factor for optimal visualization.
Usage signals:
- A breakout alert occurs when the VIX line surpasses the High VIX Level accompanied by high volume, indicating potential market breakouts driven by extreme fear or greed.
- A consolidation signal is identified when the VIX falls below the Low VIX Level, suggesting periods of low volatility, market calm, or potential mean reversion.
This indicator supports analysis across various markets including Forex, indices, commodities, stocks, and cryptocurrencies.
Profil indikator
Ulasan pelanggan
4.5
Ulasan: 2
5 | 50 % | |
4 | 50 % | |
3 | 0 % | |
2 | 0 % | |
1 | 0 % |
Ulasan pelanggan
March 6, 2025
ngl, breaks are easier to judge and that is enough to keep testing it. It is not the whole trading plan.
February 28, 2025
reads better when the chart already supports the idea. Spread and slippage need a line in the notes.
Diskusi
Pertanyaan umum
BTCUSD
Forex
Signal
Breakout
Indices
EURUSD
Commodities
GBPUSD
NZDUSD
Prop
Crypto
Stocks
XAUUSD
NAS100
USDJPY
Produk-produk yang tersedia melalui cTrader Store, termasuk bot trading, indikator, dan plugin, disediakan oleh pengembang pihak ketiga serta hanya ditujukan untuk akses teknis dan informasi. cTrader Store bukan broker dan tidak menyediakan saran investasi, rekomendasi pribadi, atau jaminan apa pun tentang kinerja di masa mendatang.


Harga
Sejak 05/02/2025
31
Penjualan