
Deskripsi
Apa itu Indikator Garis Tren?
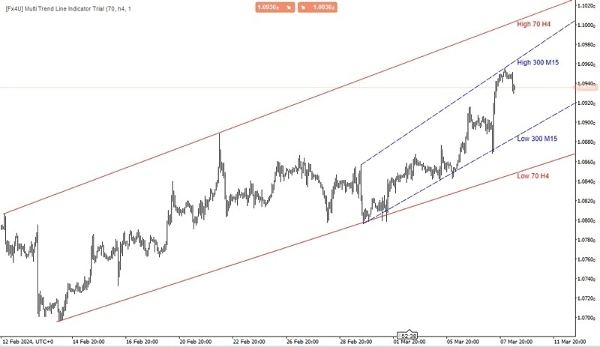
Indikator garis tren adalah alat analisis teknikal yang digunakan oleh trader dan analis untuk mengidentifikasi arah dan kekuatan tren di pasar keuangan. Ini didasarkan pada menggambar garis lurus yang menghubungkan dua atau lebih titik harga pada grafik. Tujuan utama dari garis tren adalah untuk secara visual merepresentasikan arah umum pergerakan harga selama periode tertentu.
Indikator Garis Tren Multi Timeframe
Fungsi utama dari indikator garis tren multi-timeframe adalah memberikan trader perspektif yang lebih luas tentang tren pasar dengan menggabungkan informasi dari berbagai timeframe. Dengan menganalisis tren di berbagai timeframe, trader dapat membuat keputusan yang lebih tepat mengenai titik masuk dan keluar potensial, serta arah keseluruhan pasar.
Jenis indikator ini biasanya memungkinkan trader untuk menyesuaikan timeframe yang ingin mereka analisis dan menggambar garis tren sesuai kebutuhan. Ini bisa menjadi alat yang berharga untuk mengidentifikasi level support dan resistance utama, pembalikan tren, dan kelanjutan tren di berbagai timeframe, sehingga membantu trader membuat keputusan trading yang lebih akurat.
Ada beberapa jenis garis tren, termasuk:
- Garis Tren Naik: Ini digambar dengan menghubungkan dua atau lebih titik terendah berturut-turut pada grafik harga. Ini menunjukkan tren naik, menandakan bahwa harga umumnya meningkat seiring waktu.
- Garis Tren Turun: Sebaliknya, garis tren turun digambar dengan menghubungkan dua atau lebih titik tertinggi berturut-turut pada grafik harga. Ini menunjukkan tren turun, menandakan bahwa harga umumnya menurun seiring waktu.
- Garis Tren Horizontal: Juga dikenal sebagai garis support atau resistance, ini digambar secara horizontal untuk menunjukkan area di mana pergerakan harga cenderung berhenti atau berbalik arah.
Trader sering menggunakan garis tren bersamaan dengan indikator teknikal dan metode analisis lain untuk membuat keputusan trading yang tepat. Ketika garis tren ditembus atau dilanggar, ini dapat menunjukkan potensi perubahan arah tren, memberikan sinyal trading bagi investor.
Produk saya yang lain:
https://ctrader.com/products/346
https://ctrader.com/products/336
https://ctrader.com/products/343
https://ctrader.com/products/347
https://ctrader.com/products/148
Ringkasan
Ulasan pelanggan
5 | 67 % | |
4 | 0 % | |
3 | 33 % | |
2 | 0 % | |
1 | 0 % |
![Logo "[Fx4U] GBPUSD - Price Action"](https://cdn.ctrader.com/image/webp/d80b34fc-da3c-4f01-a321-456450665649_26190)

![Logo "[Fx4U] CADJPY - Price Action"](https://cdn.ctrader.com/image/webp/1ba81247-b6b7-4f3c-a297-fa3eb1d57fe1_26195)

![Logo "[Fx4U] AUDCHF - Price Action"](https://cdn.ctrader.com/image/webp/0a22e9aa-c83b-42cd-b0b8-c1a2da593207_26148)

![Logo "[Fx4U] EURAUD - Price Action"](https://cdn.ctrader.com/image/webp/baf8dde4-1ef3-4beb-8ae2-0fed8320f65d_26177)


