
Deskripsi
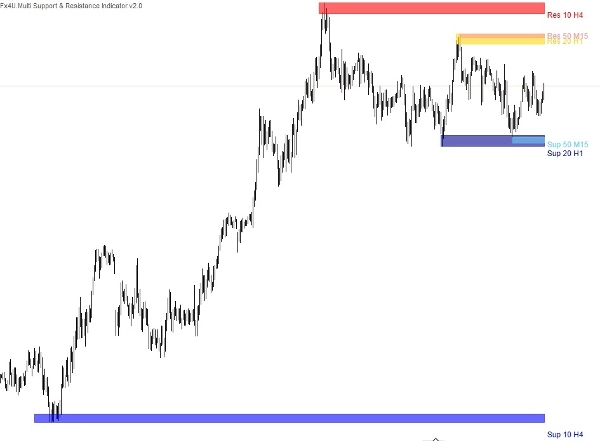
Indikator support dan resistance multi-timeframe biasanya memungkinkan trader untuk memvisualisasikan level-level ini di berbagai timeframe, seperti grafik per jam, harian, mingguan, atau bulanan. Dengan menggabungkan beberapa timeframe, trader dapat memperoleh perspektif yang lebih luas tentang di mana level harga kunci berada dan bagaimana mereka dapat memengaruhi aksi harga.
Jenis indikator ini dapat membantu trader membuat keputusan trading yang lebih terinformasi dengan mengidentifikasi level support dan resistance signifikan yang mungkin memengaruhi pergerakan harga selama berbagai timeframe. Ini juga dapat membantu trader mengantisipasi potensi pembalikan atau peluang breakout ketika harga mendekati level-level ini di beberapa timeframe.
Ada tiga jenis level support & resistance:
Tiga indikator support dan resistance dibangun dalam satu indikator ini yang memungkinkan Anda memplot zona supply dan demand pada grafik dengan pengaturan berikut.
- Nilai periode.
- Timeframe.
- Jumlah ekstremum – Ini adalah jumlah titik Support/Resistance saat ini + masa lalu yang ditampilkan. Misalnya, jika kita memilih 2, indikator akan memilih titik Support dan Resistance lain di masa lalu.
- Nama dan warna indikator.
Level support dan resistance yang signifikan pada timeframe yang lebih tinggi cenderung memiliki bobot lebih dan dengan menggunakan indikator multi-timeframe, trader dapat mengonfirmasi pentingnya sebuah level jika level tersebut muncul secara konsisten di beberapa timeframe. Konfirmasi ini meningkatkan keandalan level tersebut dan memperkuat kepercayaan trader dalam pengambilan keputusan trading mereka.
Produk saya yang lain:
https://ctrader.com/products/346
https://ctrader.com/products/336
https://ctrader.com/products/343
https://ctrader.com/products/347
https://ctrader.com/products/147
Ringkasan
The indicator consolidates three types of support and resistance levels into a single tool, allowing users to plot supply and demand zones with customizable settings such as period value, timeframe, the number of extremum points (current plus past support/resistance points), and indicator name and color. This multi-timeframe approach helps traders identify levels that carry more weight when confirmed across different timeframes, enhancing the reliability of these levels for decision-making.
By visualizing these critical zones, the indicator aids in anticipating potential price reversals or breakout opportunities. It supports a broader market overview, enabling more informed trading strategies based on the interaction of price with established support and resistance across various time horizons.
Ulasan pelanggan
5 | 33 % | |
4 | 67 % | |
3 | 0 % | |
2 | 0 % | |
1 | 0 % |
![Logo "[Fx4U] GBPUSD - Price Action"](https://cdn.ctrader.com/image/webp/d80b34fc-da3c-4f01-a321-456450665649_26190)

![Logo "[Fx4U] CADJPY - Price Action"](https://cdn.ctrader.com/image/webp/1ba81247-b6b7-4f3c-a297-fa3eb1d57fe1_26195)

![Logo "[Fx4U] AUDCHF - Price Action"](https://cdn.ctrader.com/image/webp/0a22e9aa-c83b-42cd-b0b8-c1a2da593207_26148)

![Logo "[Fx4U] EURAUD - Price Action"](https://cdn.ctrader.com/image/webp/baf8dde4-1ef3-4beb-8ae2-0fed8320f65d_26177)


