
説明
🧠 フラクタル – 市場構造の可視化
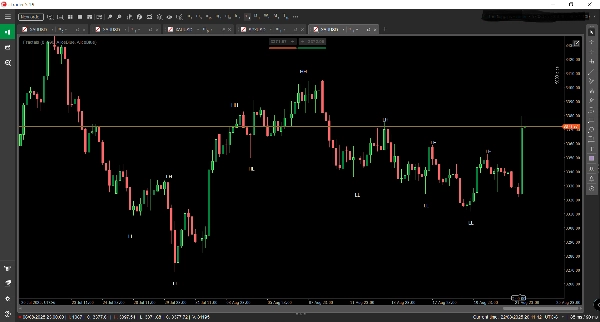
フラクタル は、価格の動きの隠れた構造を明らかにする cTrader 向けの精密に設計されたトレーディングインジケーターです。チャート上に直接 高値更新(HH)、安値切り上げ(HL)、高値切り下げ(LH)、安値更新(LL) を自動検出しラベル付けすることで、生の価格データを明確で実用的な市場構造の地図に変換します。
🔍 主な特徴:
- リアルタイム構造マッピング:スイングポイントを即座に特定し、トレンドの方向性や反転ゾーンを明らかにするためにラベル付けします。
- マルチタイムフレーム認識:上位時間軸での マクロ構造 を強調表示するよう設計されており、トレーダーが支配的なトレンドに合わせてエントリーを戦略的に調整するのに役立ちます。
- トレンドフォロー最適化: モメンタム、ブレイクアウト、またはプルバック戦略 を使用するトレーダーに理想的で、バイアスの確認や逆トレンドの罠を回避するのに役立ちます。
- クリーンなビジュアルオーバーレイ:どんなトレーディングセットアップにもシームレスに統合されるエレガントなチャート注釈で、明瞭さを高めながらも煩雑さを排除します。
🧭 使用例:
- 明らかになる前に新興トレンドや構造の変化を見つける。
- 構造的な確認でトレードセットアップを検証する。
- 移動平均、出来高、またはカスタムインジケーターと組み合わせて多層的な合流を図る。
- 構造ベースのロジックが重要な 手動バックテスト および プロップファーム評価 に最適。
概要
AIによる概要
Fractals is a trading indicator designed for the cTrader platform that visualizes market structure by automatically detecting and labeling key price action points: Higher Highs (HH), Higher Lows (HL), Lower Highs (LH), and Lower Lows (LL). It provides real-time mapping of swing points to reveal trend direction and potential reversal zones. The indicator supports multi-timeframe analysis, emphasizing macro structure on higher timeframes to help align trades with dominant market trends. Fractals is optimized for momentum, breakout, and pullback strategies, assisting traders in confirming bias and avoiding counter-trend trades. Its clean visual overlay integrates smoothly with existing chart setups, enhancing clarity without clutter. Use cases include spotting emerging trends and structural shifts early, validating trade setups with structural confirmation, combining with other indicators like moving averages or volume for layered analysis, and supporting manual backtesting and prop firm evaluations where market structure is critical. The indicator applies across various markets including Forex, indices, commodities, cryptocurrencies, and stocks.
インジケーターのプロフィール
カスタマーレビュー
4.0
レビュー: 2
5 | 0 % | |
4 | 100 % | |
3 | 0 % | |
2 | 0 % | |
1 | 0 % |
カスタマーレビュー
August 31, 2025
it gives the trade idea another check, but the result needs a journal.
August 27, 2025
ディスカッション
よくあるご質問
Prop
Forex
Indices
Commodities
Crypto
Stocks
cTrader Storeで入手可能な取引ボット、インジケーター、プラグインなどの商品は、第三者の開発者が提供するものであり、情報と技術の取得のみを目的としてご利用いただけます。cTrader Storeはブローカーではなく、投資助言や個人的な推奨を行うことも、将来のパフォーマンスを保証することもありません。


これも好きかも


価格
26
販売
2.18K
無料インストール