
説明
The Pro Heikin Ashi Visual Overlay は、標準のローソク足やバー チャートを維持しながら、Heikin Ashi キャンドルのトレンド平滑化の利点を求めるトレーダーに最適なツールです。
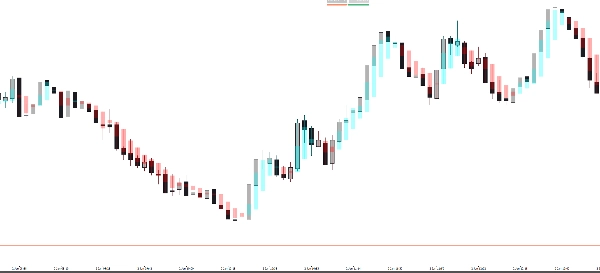
従来の Heikin Ashi チャートはチャートの種類全体を切り替える必要があり、正確な価格動向を把握しにくいです。このインジケーターは、Heikin Ashi キャンドルを 半透明のオーバーレイとして描画することでこれを解決し、実際の価格を見失うことなくトレンドの反転や市場の勢いを瞬時に把握できます。
なぜこのオーバーレイを使うのか?
- 💎 ノイズ低減: Heikin Ashi は市場のノイズを除去し、勝ちトレードを維持しやすくします。
- 🕯️ デュアルチャートビュー: 標準のローソク足で価格動向やパターンを確認しつつ、HA オーバーレイでトレンド方向を把握できます。
- 🎨 完全カスタマイズ可能: 不透明度や色を調整して作業環境(ダークモードまたはライトモード)に合わせられます。
- 🚀 瞬時のトレンド識別: 青(強気)と赤(弱気)のゾーンで勢いに逆らった取引を避けられます。
主な特徴:
- スマートな透明度: オーバーレイがメインの価格動向を隠さないように不透明度を設定できます。
- 完璧な整合性: 現在の時間枠の Heikin Ashi 値にリアルタイムで合わせて計算されます。
- プロフェッショナルなデザイン: チャートを煩雑にしないクリーンなビジュアル。
- ユニバーサル: すべての時間枠(M1から月次)およびすべての資産(FX、株式、暗号通貨、指数)で動作します。
使い方:
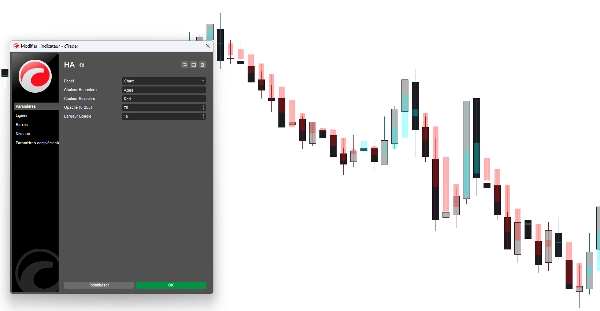
- インジケーターをチャートに適用します。
- 設定で 不透明度 と ボディ幅 を好みに合わせて調整します。
- HA キャンドルを使ってトレンドの強さを確認します:
-
- トレンド方向に長いヒゲ = 強い勢い。
- 両側にヒゲのある小さなボディ = 反転の可能性。
パラメーター:
- 強気の色: 上昇する HA キャンドルのカスタムカラー。
- 弱気の色: 下降する HA キャンドルのカスタムカラー。
- 不透明度 (0-255): キャンドルの「幽霊のような」またはしっかりした見た目を調整します。
- キャンドル幅: ズームレベルに完璧に合うように HA キャンドルの太さを調整します。
概要
AIによる概要
The Pro Heikin Ashi Visual Overlay is an indicator designed to enhance trend analysis by overlaying Heikin Ashi candles on standard candlestick or bar charts. Unlike traditional Heikin Ashi charts that replace the entire chart type, this tool provides a semi-transparent overlay, allowing traders to observe smoothed trend signals while retaining visibility of actual price action.
Key features include noise reduction to filter market fluctuations, customizable opacity and colors for integration with different chart backgrounds, and real-time alignment with the current timeframe’s Heikin Ashi calculations. The overlay uses blue and red zones to indicate bullish and bearish trends, aiding in immediate trend identification. It supports all timeframes from one minute to monthly and is compatible with various asset classes including Forex, stocks, cryptocurrencies, commodities, and indices.
Users can adjust candle width and opacity to suit their chart zoom level and visual preferences. The indicator facilitates dual-chart viewing, enabling simultaneous analysis of precise price patterns and smoothed trend momentum. It is designed with clean visuals to avoid chart clutter and supports professional trading environments.
インジケーターのプロフィール
カスタマーレビュー
4.0
レビュー: 1
5 | 0 % | |
4 | 100 % | |
3 | 0 % | |
2 | 0 % | |
1 | 0 % |
ディスカッション
よくあるご質問
Forex
Signal
Indices
Commodities
Crypto
Stocks
cTrader Storeで入手可能な取引ボット、インジケーター、プラグインなどの商品は、第三者の開発者が提供するものであり、情報と技術の取得のみを目的としてご利用いただけます。cTrader Storeはブローカーではなく、投資助言や個人的な推奨を行うことも、将来のパフォーマンスを保証することもありません。
この作成者の他の商品


価格
登録日 27/10/2025
10
販売