
Beschreibung
Das Konzept des „Reverse Engineering“
Die Hauptinnovation dieses Indikators liegt in seinem Reverse-Engineering-Algorithmus. Üblicherweise nimmt ein stochastischer Oszillator Preisdaten und wandelt sie in eine Zahl zwischen 0 und 100 um. Dieser Indikator macht das Gegenteil: Er nimmt die mathematischen Werte des Oszillators und projiziert sie zurück auf die Preisskala.
Dies ermöglicht es dem Trader, einen mathematischen Momentum direkt in ein konkretes Preisniveau ($ oder Pips) auf dem Chart zu übersetzen.
Definition der Grenzen: Die Decke (99 %) und der Boden (1 %)
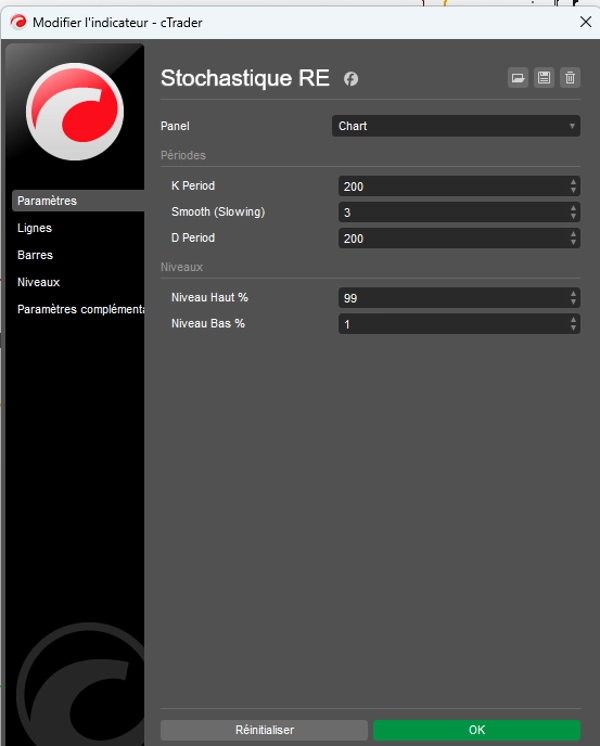
Im Gegensatz zu klassischen Einstellungen (80/20) ist dieser Indikator standardmäßig auf 1 % und 99 % eingestellt. Diese Konfiguration hat einen bestimmten Zweck: sie definiert die physischen Grenzen des Preises.
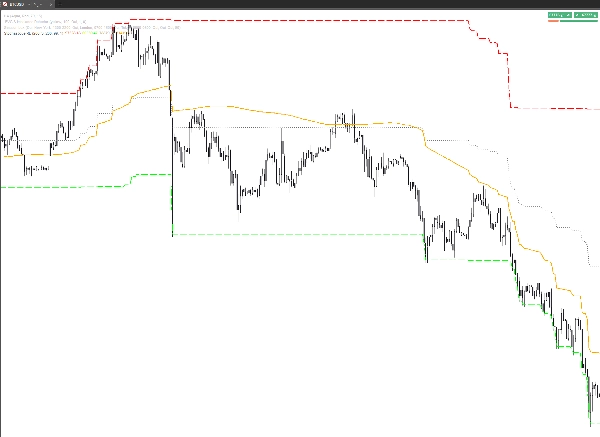
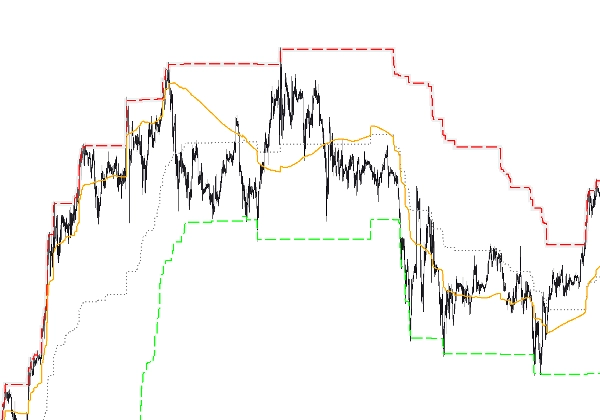
- Das 99 %-Niveau (Preisdecke): Es definiert den höchsten Preis, den der Markt erreichen kann, bevor er als erschöpft in 99 % seiner Bewegungsamplitude über den gegebenen Zeitraum betrachtet wird. Es ist die Preis-„Grenze“.
- Das 1 %-Niveau (Preisboden): Es definiert den niedrigsten Preis, die ultimative Unterstützung des aktuellen Zyklus. Es ist das Niveau, bei dem der Preis 99 % seiner Abwärtskapazität im Verhältnis zu seiner jüngsten Historie erschöpft hat.
Warum „definiert“ es den Preis?
Dank dieses Systems ist die Orange Signal %D-Linie nicht mehr nur eine Kurve, die im Vakuum verläuft.
- Preislokalisierung: Sie zeigt den genauen Standort des „fairen Preises“, gewichtet durch seinen Momentum.
- Bereichskartierung: Sie verwandelt das Chart in eine Karte, auf der man sehen kann, ob der aktuelle Preis „1 % oder 99 % seines Potenzials wert ist“.
- Konkrete Ziele: Wenn sich die orange Linie nach oben bewegt, strebt sie nicht nur an, „80“ zu erreichen; sie zielt darauf ab, den genauen Preis zu erreichen, der durch die rote Linie (99 %) angezeigt wird.
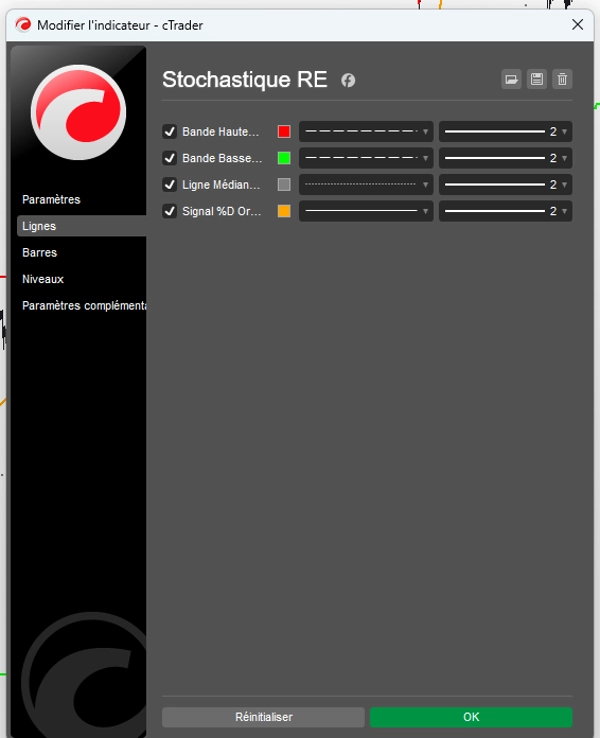
Linienfunktionen (Tab „Linien“)
Alles ist anpassbar für eine sofortige visuelle Erfassung:
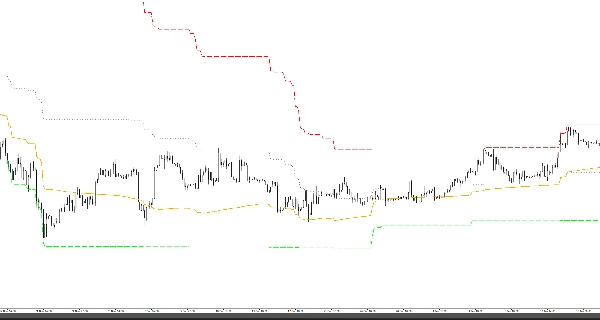
- Oberes Band (99 %): Die theoretische Preisdecke.
- Unteres Band (1 %): Der theoretische Preisboden.
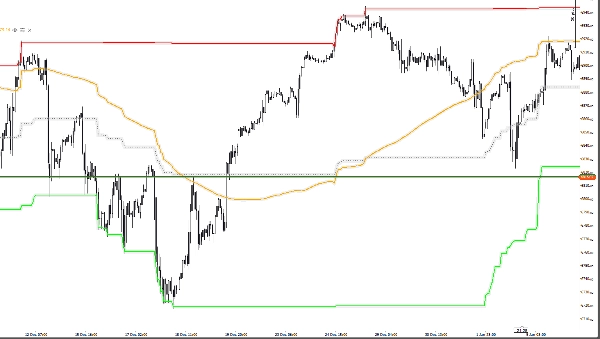
- Mittellinie (50 %): Der zentrale Drehpunkt, die Gleichgewichtszone.
- Orange Signal %D: Der dynamische Cursor, der zwischen Boden und Decke navigiert, um die Marktrichtung zu definieren.
Trader-Zusammenfassung
Dieser Indikator sagt Ihnen nicht nur, dass der Markt „überkauft“ ist; er zeigt Ihnen genau zu welchem Preis der Markt physisch zu teuer (99 %) oder zu billig (1 %) wird. Es ist ein Präzisionswerkzeug, das die Mathematik zurück in die Realität des Orderbuchs bringt.
Zusammenfassung
The indicator displays these boundaries directly on the price chart, allowing traders to see exact price levels where the market is considered overbought or oversold. Key features include customizable lines for the upper band (99%), lower band (1%), mid line (50%), and an orange signal %D line that dynamically indicates market direction between these boundaries.
By translating momentum into precise price targets, Stochastique RE helps traders localize fair price zones, map price ranges, and identify concrete price targets rather than abstract oscillator values. It supports various markets including Forex, stocks, commodities, indices, and cryptocurrencies, with symbol tags such as BTCUSD, EURUSD, GBPUSD, XAUUSD, NAS100, and USDJPY.
Kundenbewertungen
5 | 67 % | |
4 | 33 % | |
3 | 0 % | |
2 | 0 % | |
1 | 0 % |


