MARCs_MARKET_OVERVIEW_PRO
インジケーター
バージョン 1.0、Aug 2026
Windows、Mac
Trading product for MARCs_MARKET_OVERVIEW_PRO インジケーター Key Levels RSI, image 2
Trading product for MARCs_MARKET_OVERVIEW_PRO インジケーター Key Levels RSI, image 3
Trading product for MARCs_MARKET_OVERVIEW_PRO インジケーター Key Levels RSI, image 4
Trading product for MARCs_MARKET_OVERVIEW_PRO インジケーター Key Levels RSI, image 5
Trading product for MARCs_MARKET_OVERVIEW_PRO インジケーター Key Levels RSI, image 6
Trading product for MARCs_MARKET_OVERVIEW_PRO インジケーター Key Levels RSI, image 7
Trading product for MARCs_MARKET_OVERVIEW_PRO インジケーター Key Levels RSI, image 8
Trading product for MARCs_MARKET_OVERVIEW_PRO インジケーター Key Levels RSI, image 9
Trading product for MARCs_MARKET_OVERVIEW_PRO インジケーター Key Levels RSI, image 10
登録日 24/06/2026

説明

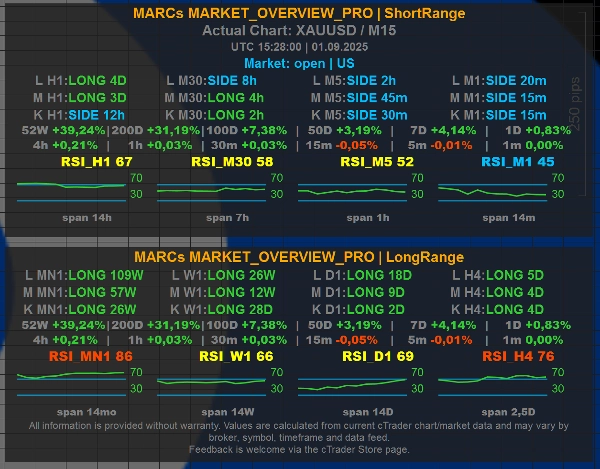
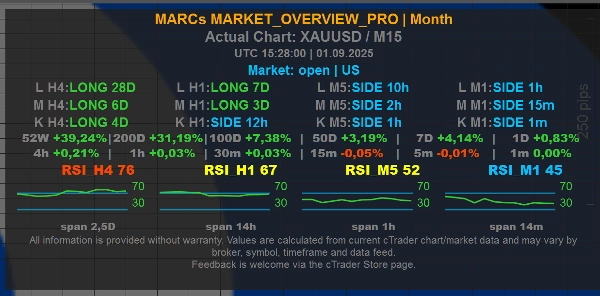
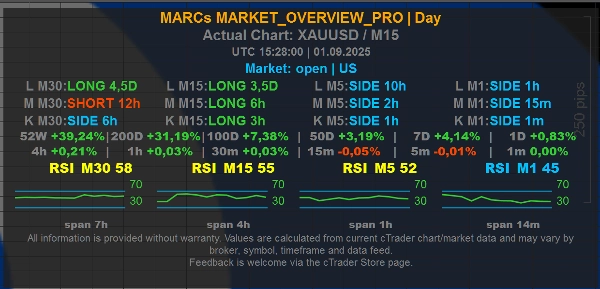
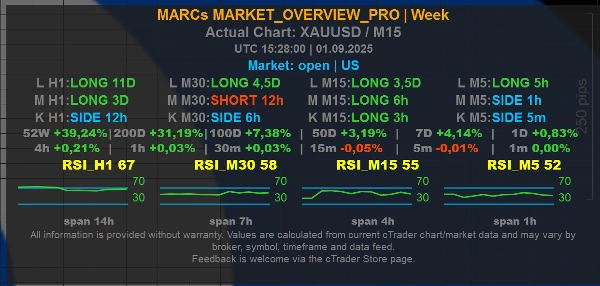
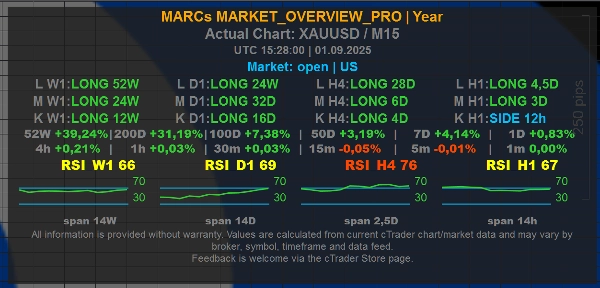
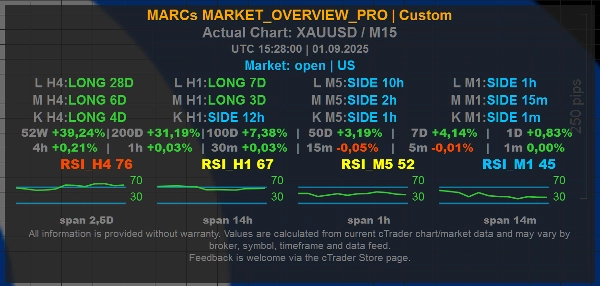
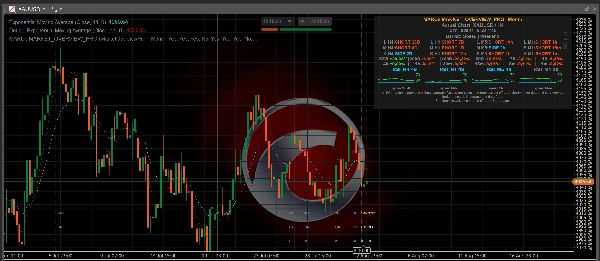
MARCs MARKET_OVERVIEW_Pro is a multi-timeframe market overview indicator for cTrader.


It displays a compact on-chart dashboard with trend context, RSI readings, market/session information and configurable time-horizon presets. The indicator was originally developed around XAUUSD / Gold analysis, but is designed to work as a general market overview tool on any available chart symbol, depending on broker data quality and available market history.


Main features:

- Multi-timeframe trend rows for short, medium and long market context

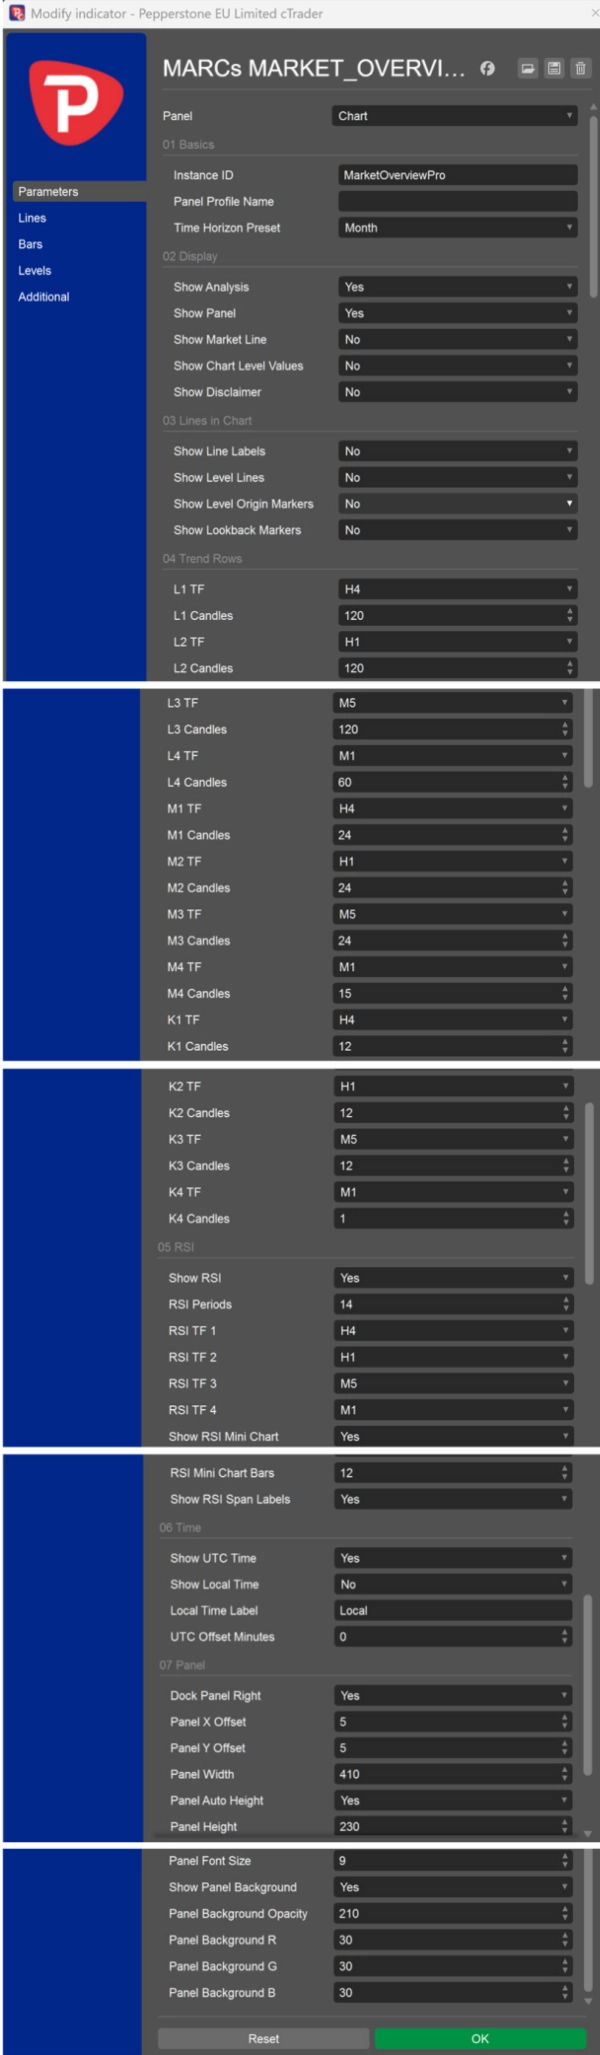
- Configurable Day, Week, Month, Year, ShortRange, LongRange and Custom presets

- RSI values and mini RSI charts across selected timeframes

- Optional UTC and local time display

- Optional market/session line

- Optional chart-level reference lines

- Optional chart-level values shown directly in the panel


Level Lines and Chart Level Values:

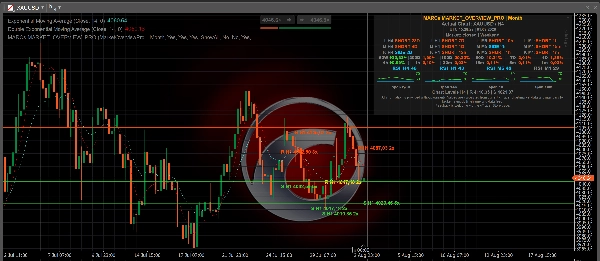
The optional Show Level Lines setting can display calculated chart reference levels from one selected timeframe: M1, M5, M15, M30, H1, H4, D1, W1 or MN1. For these individual timeframe selections, the indicator shows the nearest calculated resistance above the current price and the nearest calculated support below the current price. ShowAll displays the broader H1 level set from the existing H1 level calculation. No keeps level lines hidden.


The optional Show Chart Level Values setting can show the same nearest resistance/support reference values directly in the panel without drawing lines on the chart. The panel line is labelled, for example, "Chart Levels H1 | R ... | S ..." to make clear that the values refer to chart-level references.


How Level Lines are calculated:

The levels are derived from past swing highs and swing lows in the selected timeframe. Nearby swing points are grouped into level clusters, and only areas with enough repeated touches are shown. This makes the lines visual market-context markers based on available chart history.


Important:

MARCs Market Overview Pro is an analysis-only market overview tool. It does not place trades, manage positions, provide investment advice or guarantee trading results.


Level Lines are not buy signals, sell signals, stop-loss recommendations, take-profit recommendations or investment advice. They do not predict that price will reverse, break out or react at a specific level.


All readings depend on the available cTrader chart data, broker symbol feed, timeframe and market history. Values may differ between brokers, symbols and data feeds.


Trading involves risk. Past performance does not guarantee future results.

概要

インジケーターのプロフィール
インジケーターのカテゴリー
市場構造(SMC)
出力の種類
ビジュアル表示
フィルター
データ要件
バーのみ
サポート対象のシグナル
トレンドの強さ
ラインタッチ

カスタマーレビュー

0.0
レビュー: 0
カスタマーレビュー
この商品にはまだレビューがありません。お使いになったことがある方は、ぜひレビューをお願いします。

ディスカッション

よくあるご質問

Key Levels
RSI
Market Structure
Risk Dashboard
Support & Resistance
cTrader Storeで入手可能な取引ボット、インジケーター、プラグインなどの商品は、第三者の開発者が提供するものであり、情報と技術の取得のみを目的としてご利用いただけます。cTrader Storeはブローカーではなく、投資助言や個人的な推奨を行うことも、将来のパフォーマンスを保証することもありません。

この作成者の他の商品

インジケーター
RSI
Key Levels
+3
MARKs Free XAUUSD market overview dashboard with trend rows, RSI context, sessions and fixed Day/Month presets.
cBot
Conservative
Fixed Risk %
+5
MARCs GOLD H4-Gold-Swing-Bot for XAUUSD with transparent long-term backtests and optional reserve/guard system.
3.01
プロフィットファクター

これも好きかも

インジケーター
ATR
BOS
+5
Full ICT/SMC 4-step setup checker that alerts a long or short setup.
インジケーター
BOS
CHOCH
+5
A professional-grade cTrader indicator for traders following the Inner Circle Trader (ICT) methodology. It replaces 6–8
インジケーター
AI
SMC
+9
Identifies market trends (-10 to +10) using HMA with volume confirmation. Includes customizable alerts.
インジケーター
ATR
SMC
+2
HTF POWER 3 ICT Power of 3 · M1 Precision · H4 Intelligence Auto-detect Accumulation → Manipulation → Distribution
インジケーター
Triangle
Double Top
+5
Know which liquidity sweeps are real. Auto-tracks EQH/EQL and confirms genuine reversals, not just broken levels.
インジケーター
Drawdown Monitor
Proprietary trading desk risk monitoring dashboard!
インジケーター
MACD
Prop
+14
Enhance MACD Histogram! Visualize bull and bear price changes with vibrant colors for clearer, more insightful trading.
インジケーター
AI
ATR
+26
Entry Momentum MACD Power Guide
インジケーター
BOS
EMA
+5
Directional volume heatmap: see if a price zone was built on buying or selling, not just how much.
インジケーター
AI
ATR
+19
QX SessionBox ORB: Session boxes + ORB levels + clean dashboard with optional closed-candle breakout signals.
インジケーター
VWAP
Moving Average
Vwap Bands it is highly sought after by professional traders because it includes Standard Deviation Bands
インジケーター
ATR
BTCUSD
+5
Trailing algo 📈 auto-tracks trends 🎯 adapts to volatility 🌟 precise moves 🛡️ retest signals 🚀 no lag, smart market
インジケーター
Forex
Multi-timeframe candlesticks!
インジケーター
AI
RSI
+18
Session boxes with UTC offset, OR logic, adjustable opacity, and multi-day lookback.
インジケーター
Forex
GBPUSD
+5
Visual warning zones for high-impact news so you can manage risk before volatility hits.
インジケーター
AI
ATR
+27
Nadaraya-Watson Envelope Indicator
インジケーター
ATR
Volume
+4
This allows traders to see not just the trend, but whether the momentum itself is overextended.
インジケーター
Market Sessions

価格

登録日 24/06/2026