
説明
ボラティリティブレイクアウトインジケーター - ホークスボラティリティエンジン
このインジケーターは即時の取引アクションではなく、コンテキストを提供することを目的としています。ボラティリティの要素は、市場の状況が変化している時期を知るのに役立ちます。低ボラティリティの期間は大きな動きの前触れであることが多く、高ボラティリティの期間は最終的に収束します。EWMAの要素は、発展中のトレンドに沿って方向付けを行い、価格がトレンドから離れている時を強調します。
これら二つの視点を組み合わせて - ボラティリティレジームとトレンドのコンテキスト - ご自身の取引手法と判断と合わせてください。インジケーターは環境を示しますが、そこで何をするかはあなた次第です。
バージョン 2.0
今後のアップデートに対応
-----------------------------------------------------------------------------------------------------------------------------------------------------------------------
概要
-----------------------------------------------------------------------------------------------------------------------------------------------------------------------
このインジケーターは、トレーダーがボラティリティレジームとトレンドの状況を同時に識別するのを助けるために、二つの異なる要素を組み合わせています。
最初の要素はホークスプロセスを使用して市場のボラティリティの変化を検出します。従来のボラティリティインジケーターとは異なり、方向を予測するのではなく、市場が静かな圧縮状態から活発なボラティリティに移行しているか、またはその逆かを示す信号を出します。これはボラティリティ状態検出器のようなもので、状況が熱くなっているか冷えているかを教えますが、価格がどちらに動くかは示しません。
二つ目の要素は、価格チャートに重ねて表示される二重のEWMA(指数加重移動平均)システムを追加します。これにより、速い移動平均と遅い移動平均のクロスオーバーを使ってトレンドのコンテキストを提供し、価格がトレンドから乖離している時にキャンドルの色付けで示します。
-----------------------------------------------------------------------------------------------------------------------------------------------------------------------
動作方法
-----------------------------------------------------------------------------------------------------------------------------------------------------------------------
ボラティリティ検出: インジケーターはパーキンソンの高安ボラティリティ推定器を使用します。これは標準のATRより効率的な方法で、バーの全範囲を利用します。この正規化されたボラティリティはホークスプロセス計算に入力され、動的な分位点ベースの閾値と比較されます。
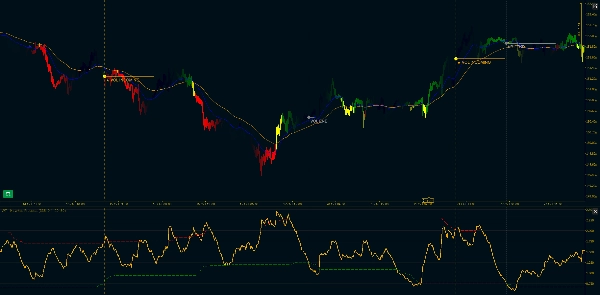
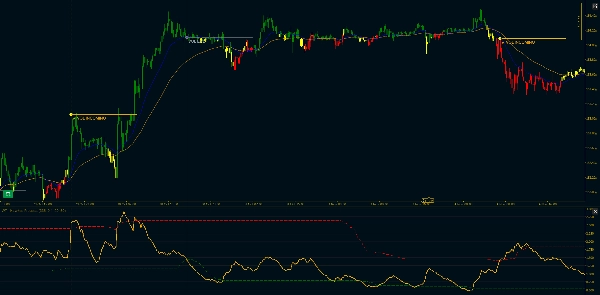
ボラティリティが圧縮期間の後に上限閾値を超えると「VOL INCOMING」信号が出ます。下限閾値を下回ると「VOL END」が表示されます。これらはエントリー信号ではなく、ボラティリティレジームの変化を示します。市場が目覚めているか眠りに入っているかを示しています。
トレンドコンテキスト: 速い移動平均と遅い移動平均の二つの指数加重移動平均がメインチャートに表示されます。速いMAは青、遅いMAはオレンジです。速いMAが遅いMAの上にあるとトレンドは上昇、下にあると下降です。
乖離フィルター: ここが面白い部分です。時々価格がトレンドから大きく離れることがあります。上昇トレンド中にキャンドル全体(始値、高値、安値、終値)が速いMAの下にある場合、または下降トレンド中に速いMAの上にある場合、そのバーは黄色に変わります。これは厳格なフィルターで、ヒゲが速いMAに触れるだけでも通常のトレンド色のままです。
黄色のバーは戻りや疲弊ポイントでよく現れますが、次に何が起こるかを示すものではなく、価格が一時的にトレンドラインから離れていることを示しています。
-----------------------------------------------------------------------------------------------------------------------------------------------------------------------
主な特徴
-----------------------------------------------------------------------------------------------------------------------------------------------------------------------
ボラティリティコンポーネント:
- パーキンソン高安ボラティリティ正規化(標準ATR法より効率的)
- 調整可能な減衰(カッパパラメーター)を用いたホークスプロセス計算
- 動的な分位点ベースの閾値(カスタマイズ可能なパーセンタイル)
- 視覚的マーカー:「VOL INCOMING」はボラティリティブレイクアウト時、「VOL END」は圧縮時に表示
- 継続フィルタリング:最初のブレイクアウトのみマークし、すべてのスパイクをマークしない
- オプションの水平トレンドラインと垂直マーカー
EWMAトレンドコンポーネント:
- Pandas互換のEWMA計算(adjust=Trueの式)
- メイン価格チャートに表示される速いMAと遅いMAのライン
- カスタマイズ可能なスパン長(デフォルト:20/50)
- 最小期間サポート(十分なデータが得られるまで出力を抑制)
- ギャップ処理のためのNA無視オプション
- 三色キャンドルシステム:緑(上昇トレンド)、赤(下降トレンド)、黄色(乖離)
カスタマイズオプション:
- パーキンソン期間(ボラティリティ計算のための遡及期間)
- ホークスカッパ(減衰率、感度に影響)
- 分位点遡及期間
- 低・高ボラティリティ閾値(パーセンタイル)
- 年率換算の切り替えとセグメント長
- 移動平均の速い・遅いスパン
- 強気、弱気、乖離の色設定
- トレンドラインの延長長さ
- 垂直マーカーの表示/非表示
----------------------------------------------------------------------------------------------------------------------------------------------------------------------------
技術的注意事項: ホークスプロセスの要素はリアルタイム使用に最適化された再帰的指数計算を使用しています。EWMAの実装はPythonベースのバックテストとの一貫性のためにPandasの挙動に合わせています。両方の要素は再描画を避けるためにクローズバーのみで計算されます。
概要
カスタマーレビュー
5 | 100 % | |
4 | 0 % | |
3 | 0 % | |
2 | 0 % | |
1 | 0 % |


