
Volume Bubble
インジケーター
757 ダウンロード数
バージョン 1.0、Nov 2025
Windows、Mac
4.0
レビュー: 1
説明
Volume Bubbles – cTrader カスタムインジケーター
Volume Bubbles は、cTrader用の軽量でありながら強力な視覚インジケーターで、特別な出来高 を価格チャート上に直接強調表示します。
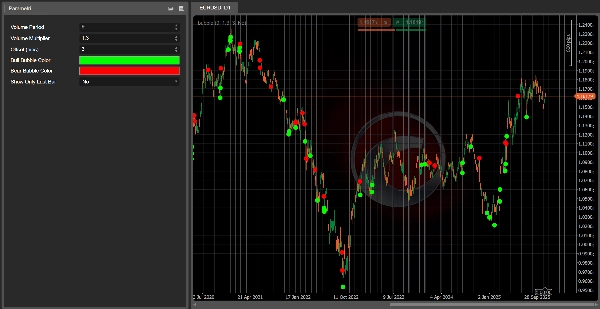
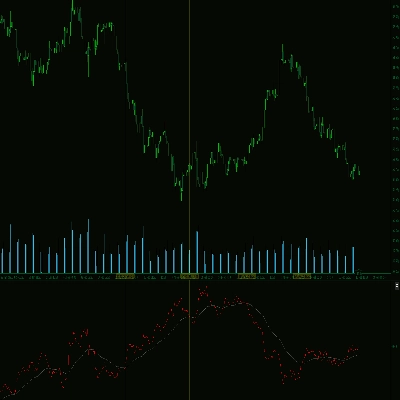
出来高ヒストグラムをじっと見つめてどのバーが本当に重要かを推測する代わりに、このツールは現在のローソク足の出来高が最近の平均よりも著しく高い場合を自動的に検出し、そのバーに バブル(円形アイコン) を描画します:
- 強気ローソク足の場合、バブルはローソク足の 安値の下 に描かれます。
- 弱気ローソク足の場合、バブルはローソク足の 高値の上 に描かれます。
これにより、潜在的な クライマックス的な動き、大口プレイヤーの強い関心エリア、またはトレンドの可能な疲弊ポイントを非常に簡単に見つけることができます。
主な特徴
- ✅ ティック出来高の移動平均を使用して 高出来高ローソク足 を検出
- ✅ チャート上に 明確なバブルを描画 (追加のサブウィンドウ不要)
- ✅ 強気 と 弱気 の出来高急増に異なる色を使用
- ✅ バブルをローソク足から離して配置するための調整可能な オフセット(ピップ単位)
- ✅ 最新バーのみにバブルを表示 するオプション(リアルタイム取引用)
入力 / パラメーター
- Volume Period – 出来高移動平均に使用されるバーの数。
- Volume Multiplier – バブルをトリガーするためにバーが平均出来高の何倍である必要があるか。
- Offset (pips) – バブルとローソク足の高値/安値間の距離。
- Bull Bubble Color – 強気ローソク足のバブルの色。
- Bear Bubble Color – 弱気ローソク足のバブルの色。
- Show Only Last Bar – trueの場合、現在のライブバーのみにバブルを表示。
使い方
チャートに Volume Bubbles を追加し、視覚的フィルターとして以下に使用します:
- 強い出来高を伴う ブレイクアウトの確認
- 可能な 反転 や 疲弊ローソク足
- 大口プレイヤーが活動している可能性のある ゾーンの特定
これは単独の取引システムではありませんが、出来高を重視する価格アクションやトレンドフォロー戦略にとって優れた補助ツールです。
👉 こちらから参加: Algotrendit Volume Bubbles
サーバー内には以下があります:
- このcBotや他のインジケーターのサポート
- 戦略の議論や最適化のアイデア
- 私がリリースするアップデート、ニュース、将来のツール
概要
AIによる概要
Volume Bubbles is a custom indicator for the cTrader platform designed to visually highlight candles with exceptional volume directly on the price chart. It detects high-volume bars by comparing the current candle’s tick volume against a moving average of recent volumes. When a candle’s volume significantly exceeds this average, the indicator draws a colored bubble: below the low for bullish candles and above the high for bearish candles. This visual cue helps traders identify potential climactic moves, areas of strong interest from large market participants, or possible trend exhaustion points.
Key features include adjustable parameters such as the volume period for averaging, volume multiplier threshold, bubble offset in pips, and customizable colors for bullish and bearish volume spikes. Users can also choose to display bubbles only on the latest bar for real-time trading. The indicator integrates directly on the price chart without requiring additional subwindows.
Volume Bubbles serves as a visual filter to confirm breakouts supported by strong volume, spot possible reversals or exhaustion candles, and identify zones of significant market activity. It complements price action and trend-following strategies by providing volume-based insights across various markets including forex, indices, commodities, stocks, and cryptocurrencies.
インジケーターのプロフィール
カスタマーレビュー
4.0
レビュー: 1
5 | 0 % | |
4 | 100 % | |
3 | 0 % | |
2 | 0 % | |
1 | 0 % |
カスタマーレビュー
November 24, 2025
Volume Bubble highlights candles with significantly high volume by drawing bubbles right on the price chart - simple, clever, and efficient. Great for spotting potential climactic moves, blow-offs, or breakout confirmation without diving into separate volume windows. Just remember: context matters. Alerts and built-in stats would make it even better.
ディスカッション
よくあるご質問
Signal
Indices
Commodities
GBPUSD
RSI
Bollinger
Fibonacci
Scalping
AI
XAUUSD
NAS100
MACD
BTCUSD
Forex
Breakout
EURUSD
NZDUSD
Martingale
Prop
ZigZag
Supertrend
Fair Value Gap
SMC
Crypto
Grid
Stocks
ATR
USDJPY
VWAP
cTrader Storeで入手可能な取引ボット、インジケーター、プラグインなどの商品は、第三者の開発者が提供するものであり、情報と技術の取得のみを目的としてご利用いただけます。cTrader Storeはブローカーではなく、投資助言や個人的な推奨を行うことも、将来のパフォーマンスを保証することもありません。


価格
42.11M
取引数量
6.13M
獲得pips
211
販売
8.1K
無料インストール