
Breakout channel
Indicador
525 transferências
Versão 1.0, Nov 2025
Windows, Mac
Descrição
Canais de Rompimento
O que faz
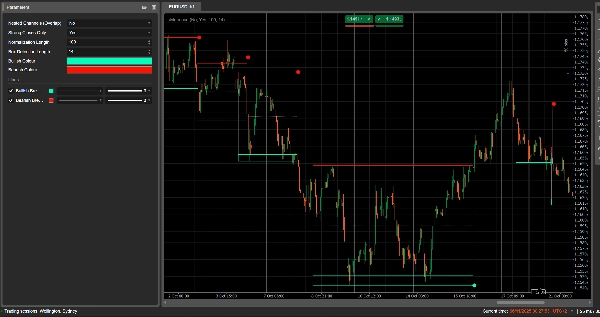
Canais de Rompimento detecta automaticamente faixas de consolidação (”caixas” de preço) e marca pontos de rompimento quando o preço sai dessas faixas.
Ele desenha:
- Uma caixa cinza do canal ao redor da zona de consolidação
- Uma banda superior vermelha (resistência potencial)
- Uma banda inferior verde (suporte potencial)
- Uma linha média pontilhada branca (ponto médio do canal)
- Pontos coloridos quando ocorre um rompimento:
-
- Ponto verde/ciano abaixo da caixa → rompimento de alta
- Ponto vermelho acima da caixa → rompimento de baixa
A ideia é destacar visualmente áreas onde o preço está se comprimindo e onde movimentos fortes provavelmente começarão quando a faixa for rompida.
Como calcula
- Normalização do preço
-
- Nos últimos Normalization Length candles, encontra a máxima máxima e a mínima mínima.
- Normaliza o fechamento para um intervalo de 0 a 1:
normalizedPrice=Close−LowestLowHighestHigh−LowestLow\text{normalizedPrice} = \frac{\text{Close} - \text{LowestLow}}{\text{HighestHigh} - \text{LowestLow}}normalizedPrice=HighestHigh−LowestLowClose−LowestLow
- Medida de volatilidade
-
- Calcula o desvio padrão do preço normalizado ao longo de 14 candles.
- Isso gera uma série de volatilidade usada para detectar pontos de inflexão na estrutura do mercado.
- Linhas “de volatilidade” superior/inferior
-
- Nos últimos (Box Detection Length + 1) candles, encontra:
-
- o candle onde a volatilidade foi mais alta
- o candle onde a volatilidade foi mais baixa
- A partir de quantos candles atrás esses extremos ocorreram, constrói duas linhas sintéticas: Superior e Inferior.
- Cruzes entre essas linhas sinalizam início/fim potencial de uma fase de canal.
- Início e duração do canal
-
- Quando Inferior cruza acima da Superior, o indicador marca um início potencial do canal.
- A partir desse candle, acompanha a duração e a máxima máxima / mínima mínima no período.
- Criação do canal
-
- Quando depois Superior cruza de volta acima da Inferior, e a duração é maior que 10 candles:
-
- Define o Topo do canal como a máxima máxima nesse período.
- Define o Fundo do canal como a mínima mínima.
- Mede o atual ATR/2 para separar uma zona fina no topo e no fundo:
-
- Banda vermelha no topo (banda de baixa)
- Banda verde no fundo (banda de alta)
- Desenha:
-
- Retângulo de contorno cinza (canal completo)
- Contorno superior vermelho
- Contorno inferior verde
- Uma linha média pontilhada branca pelo centro
- Os canais permanecem no gráfico como estrutura histórica (não são apagados após o rompimento).
- Detecção de rompimento
-
- Para cada canal ativo, a cada novo candle calcula um preço de referência:
-
- Se Strong Closes Only = true → usa o ponto médio do corpo da vela:
refPrice=(Open+Close)/2\text{refPrice} = (\text{Open} + \text{Close})/2refPrice=(Open+Close)/2
Isso requer que mais da metade do corpo esteja fora da caixa. - Se Strong Closes Only = false → usa o simples fechamento.
- Se Strong Closes Only = true → usa o ponto médio do corpo da vela:
- Regras de rompimento:
-
- Se
refPrice > Top→ rompimento de alta -
- Desenha um ponto verde no Fundo do canal.
- Desativa este canal (para de estendê-lo), mas a caixa permanece visível.
- Se
refPrice < Bottom→ rompimento de baixa -
- Desenha um ponto vermelho no Topo do canal.
- Desativa o canal.
- Caso contrário, o canal continua ativo e sua borda direita é estendida até o candle atual.
- Se
- Opção de Canais Aninhados
-
- Se Nested Channels = true, múltiplos canais podem se sobrepor no tempo e no preço.
- Se false, o indicador bloqueia a criação de um novo canal que se sobreporia a um existente.
Como ler e usar
- Caixa cinza (canal)
-
- Representa uma zona de consolidação / equilíbrio onde o preço tem negociado por um tempo.
- Quanto mais longa e alta a caixa, mais significativa é a faixa.
- Banda superior vermelha (zona de resistência)
-
- A parte superior do canal, visualmente destacada como uma área potencial de resistência.
- Rejeições repetidas próximas a essa banda sugerem pressão de venda dentro da faixa.
- Banda inferior verde (zona de suporte)
-
- A parte inferior do canal, destacada como suporte potencial.
- Rebotes repetidos sugerem compradores defendendo a borda inferior da faixa.
- Linha média pontilhada branca
-
- O ponto médio do canal – uma espécie de “valor justo” local.
- Preço oscilando em torno dessa linha indica equilíbrio; movimentos fortes para longe dela frequentemente precedem um teste da banda oposta.
- Pontos de rompimento
-
- Ponto verde abaixo da caixa:
-
- O preço fechou fortemente acima do topo do canal (ou simplesmente fechou acima, dependendo de Strong Closes Only).
- Sugere um rompimento de alta – início potencial de um movimento de alta após uma compressão de volatilidade.
- Ponto vermelho acima da caixa:
-
- O preço fechou fortemente abaixo do fundo do canal.
- Sugere um rompimento de baixa – início potencial de um movimento de baixa.
- Formas típicas de uso (nível de ideia)
-
- Rompimentos seguindo a tendência
-
- Negocie na direção do rompimento (compre após ponto verde, venda após ponto vermelho), idealmente em confluência com a tendência de timeframe maior ou outros indicadores.
- Filtro e confirmação
-
- Use o canal e seu rompimento apenas como filtro para sua estratégia existente (ex: só faça setups longos se o último sinal foi um rompimento de alta).
- Posicionamento de risco
-
- Para rompimentos de alta, muitos traders colocam stops dentro ou logo abaixo do canal anterior; para rompimentos de baixa, dentro ou acima da caixa.
Resumo
Resumo de IA
Breakout Channels is a technical indicator designed to identify consolidation zones and signal potential price breakouts. It automatically detects price ranges where the market is coiling, marking these with a grey channel box that highlights the consolidation area. The indicator draws a red upper band indicating potential resistance, a green lower band indicating potential support, and a white dotted midline representing the channel midpoint or local fair value.
Breakout points are signaled by colored dots: a green or cyan dot below the box indicates a bullish breakout, while a red dot above signals a bearish breakout. The indicator calculates these zones by normalizing price data, measuring volatility through the standard deviation of normalized prices, and identifying volatility extremes to define channel start and duration.
Channels remain visible on the chart as historical structures even after breakouts. Users can enable nested channels to allow overlapping consolidation zones. Breakout detection uses either candle body midpoints or close prices, depending on settings, to confirm strong closes outside the channel.
Typical uses include trading in the breakout direction, filtering existing strategies, and placing risk stops near channel boundaries. The indicator supports various markets including forex, indices, commodities, stocks, and cryptocurrencies.
Perfil do indicador
Avaliações de clientes
0.0
Avaliações: 0
Avaliações de clientes
Ainda não há avaliações para este produto. Já o experimentou? Seja o primeiro a contar a outras pessoas!
Conversa
Perguntas frequentes
Signal
Indices
Commodities
GBPUSD
RSI
Bollinger
Fibonacci
Scalping
AI
XAUUSD
NAS100
MACD
BTCUSD
Forex
Breakout
EURUSD
NZDUSD
Martingale
Prop
ZigZag
Supertrend
Fair Value Gap
SMC
Crypto
Grid
Stocks
ATR
USDJPY
VWAP
Os produtos disponíveis através da cTrader Store, incluindo bots de negociação, indicadores e plugins, são fornecidos por programadores terceiros e são disponibilizados apenas para fins informativos e de acesso técnico. A cTrader Store não é um corretor e não fornece aconselhamento em matéria de investimento, recomendações pessoais ou qualquer garantia de desempenho no futuro.


Preço
42.11M
Volume negociado
6.13M
Pips ganhos
230
Vendas
8.52K
Instalações gratuitas