
Açıklama
Pinescritlabs
Ctrader Store göstergeleri: 🤖Pinescritlabs Ctrader Store cBots:
Adil Değer Boşluğu Oturumları Altın & BTC Kırılma Oturumu Pivotları(yeni)
Dinamik Piyasa Yapısı
Dönüş Noktalarının Analizi
Fibonacci Lineer
Regresyon Çoklu Zaman Dilimi
Çok Seviyeli Mum Eğilimi
Takipçisi
Otomatik Destek ve
Direnç Trend Çizgileri
Tüm Destek ve
Direnç Seviyeleri
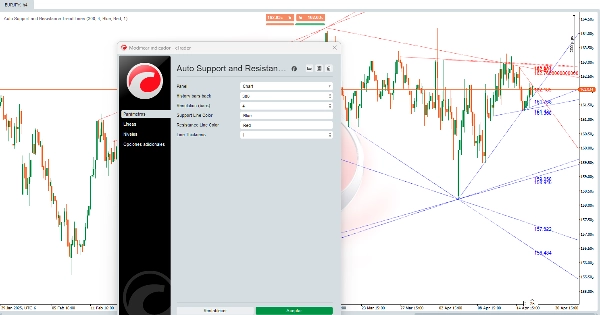
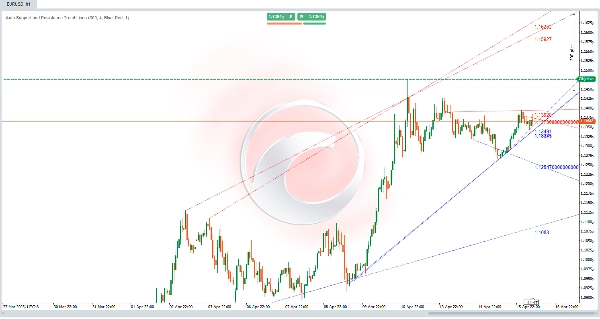
Otomatik Destek ve Direnç Trend Çizgileri:
Bu algoritma, bir fiyat grafiğinde otomatik olarak destek ve direnç seviyelerini tanımlamak için tasarlanmış güçlü bir araçtır 🛠️. Sadece yatay çizgiler çizmekle kalmaz, aynı zamanda piyasa trendlerini temsil eden diyagonal kanalları ↗️↘️ izler. Bu seviyeler ve kanallar, fiyatın yukarı (direnç 🚧) veya aşağı (destek 🛡️) hareket etmekte zorlandığı önemli alanlardır ve bu da onları ticaret kararları için kritik noktalar yapar. 📈📉
Hesaplamalar Nasıl Yapılır? 🔍
Algoritma, destek ve direnç seviyelerini tanımlamak için fiyat geçmişi analiz yaklaşımını 📊 kullanır. İşte çalışma şekli:
- Yerel Dip ve Zirvelerin Tanımlanması ⬇️⬆️
-
- Algoritma, belirli bir bar (mum) aralığında fiyatı analiz ederek yerel dipleri (bu aralıktaki en düşük fiyatlar) ve yerel zirveleri (bu aralıktaki en yüksek fiyatlar) bulur.
- Bu yerel dipler ve zirveler, destek ve direnç seviyeleri olma potansiyeline sahip adaylardır.
- Seviyelerin Doğrulanması ✔️
-
- Yerel dipler ve zirveler belirlendikten sonra, algoritma bu seviyelerin geçmişte fiyat tarafından saygı görüp görmediğini kontrol eder.
- Fiyat bir seviyeye birden fazla kez dokunmuş ancak net bir şekilde kırmamışsa, bu seviye geçerli bir destek veya direnç seviyesi olarak kabul edilir.
- Çizgilerin ve Kanalların Çizilmesi ✏️
-
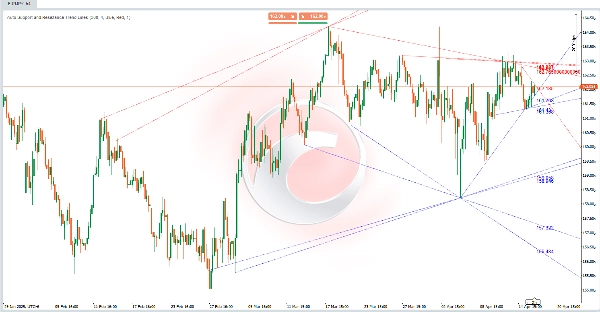
- Destek seviyeleri, doğrulanmış yerel diplerde yatay (veya diyagonal) çizgiler olarak çizilir.
- Direnç seviyeleri, doğrulanmış yerel zirvelerde yatay (veya diyagonal) çizgiler olarak çizilir.
- Ayrıca, algoritma bu seviyeleri birleştirerek diyagonal kanallar ↗️↘️ oluşturur; bu kanallar piyasa içindeki yükseliş veya düşüş trendlerini temsil eder.
- Dinamik Güncellemeler 🔄
-
- Gösterge, her yeni bar ile otomatik olarak güncellenir ve en son fiyat davranışına göre destek ve direnç seviyelerini yeniden hesaplar ve çizer.
Bu Algoritma Tüccarlara Nasıl Yardımcı Olur? 💡
Bu algoritma, tüccarlar için oyunun kurallarını değiştiren bir araçtır çünkü:
- Piyasanın Makro Görünümünü Sağlar 🌐
-
- Algoritma, diyagonal kanallar çizerek, ana piyasa trendlerini gösterir ve tüccarların fiyatın bir yükseliş trendinde 📈, düşüş trendinde 📉 veya yatay hareket halinde ↔️ olup olmadığını belirlemesine yardımcı olur.
- Ana Destek ve Direnç Alanlarını Belirler 🎯
-
- Destek ve direnç seviyeleri, fiyatın sıçrayabileceği veya kırabileceği bölgeler olarak tanımlanır. Bu seviyeler şunlar için faydalıdır:
-
- Alım ve satım giriş ve çıkış noktalarının belirlenmesi.
- Stop-loss 🛑 ve kar al ✅ emirlerinin yerleştirilmesi.
- Fiyatın kırılmalarını 🚀 veya dönüşlerini 🔄 tanımlama.
- Teknik Analizi Basitleştirir 🕒
-
- Algoritma, destek ve direnç tanımlama sürecini otomatikleştirir ve manuel analiz yapan tüccarlar için zaman kazandırır.
- Seviyeleri ve kanalları net bir şekilde göstererek, tüccarların daha bilinçli kararlar vermesine yardımcı olur.
- Özelleştirilebilir 🎨
-
- Tüccarlar, analiz edilen tarihsel bar sayısı, çizgi kalınlığı ve renkler gibi parametreleri ayarlayabilir, böylece gösterge farklı ticaret stillerine ve görsel tercihlere uyarlanabilir.
Pratik Örnek 📌
Bir fiyat grafiğini analiz ettiğinizi ve algoritmanın şunları çizdiğini hayal edin:
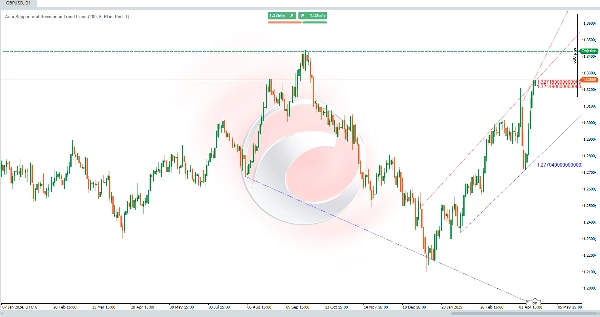
- Bir diyagonal destek çizgisi ↗️ birkaç yerel dip noktayı birleştirerek bir yükseliş trendini gösterir.
- Bir diyagonal direnç çizgisi ↗️ birkaç yerel zirveyi birleştirerek bir yukarı yönlü kanal gösterir.
- Birçok yatay çizgi ana destek ve direnç seviyelerini temsil eder.
Bu bilgilerle şunları yapabilirsiniz:
- Fiyatın bir yükseliş trendinde 📈 olduğunu belirleyin.
- Diyagonal destek çizgisi veya yatay destek seviyeleri yakınında alım fırsatları arayın.
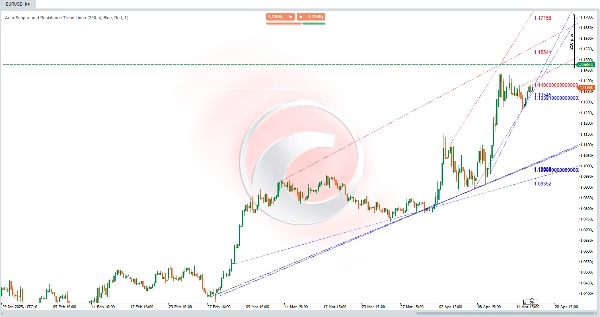
- En yakın destek seviyesinin altında bir stop-loss 🛑 belirleyin.
- Fiyatın direnci kırıp kırmadığını gözlemleyin ve böylece trendin devamını veya olası bir dönüşü 🔄 teyit edin.
Özet
Once validated, support and resistance levels are drawn as horizontal or diagonal lines, and connected to form channels indicating bullish or bearish trends. The indicator updates dynamically with each new bar, recalculating and redrawing levels to reflect the most recent price behavior.
This tool aids traders by providing a macro view of market trends, identifying zones where price may bounce or break, and simplifying technical analysis through automation. It supports setting entry and exit points, stop-loss and take-profit orders, and spotting potential breakouts or reversals. Parameters such as the number of historical bars analyzed, line thickness, and colors can be customized to fit different trading styles and preferences.


!["[CB] Pivot Points Pro" logosu](https://cdn.ctrader.com/image/webp/43463c82-67b0-4f10-a4ba-901bba091d81_32594)