Brokers & props
For business
00
Days
:
00
Hours
:
00
Minutes
:
00
Seconds
Indicator
RSI
Indices
Breakout
XAUUSD
Commodities
Stocks
Forex
Signal
Supertrend
Crypto
BTCUSD
RSI Trend Trigger
4.6
03/09/2025
655
Desktop
Since 03/10/2024
Sales
128
Free installs
25652
"RSI Trend Trigger" uploaded image"RSI Trend Trigger" uploaded image"RSI Trend Trigger" uploaded image"RSI Trend Trigger" uploaded image"RSI Trend Trigger" uploaded image"RSI Trend Trigger" uploaded image


🔥  Pinescritlabs
Ctrader Store indicators:                        🤖Pinescritlabs Ctrader Store cBots:

 Fair Value Gap Sessions                         Gold & BTC Breakout Session Pivots

ZigZag

 BOS & CHOCH

RSI Trend Trigger

Channel Breakout System

Supertrend

Market Imbalance

Adaptive Trend Channel 

Dynamic Market Structure
Analysis of Turning Points

Order Block

Fibonacci Linear
Regression Multi-timeframe

Volume POC Heatmap

Dynamic RSI

Momentum Fair Value Gap

Market Flow Projection

Dynamic Trend Gradient

Multi-Level Candle Bias
Tracker

Zig-Zag Extremity Tracker

Reactive Moving Average

Auto-Trend Channel

Auto Support and
Resistance Trend Lines

All Support and
Resistance Levels

Leverage Liquidation Map

Zones Supply Demand

Dynamic Range Momentum


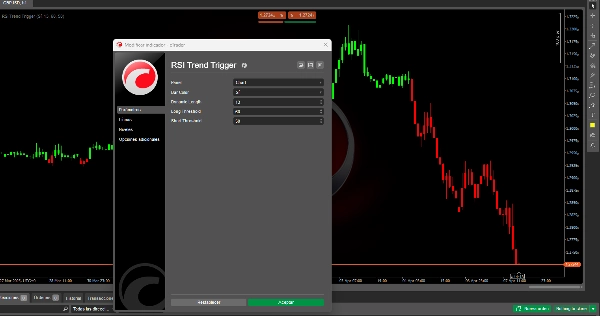
RSI Trend Trigger 📈✨


How Does It Work? 🤔

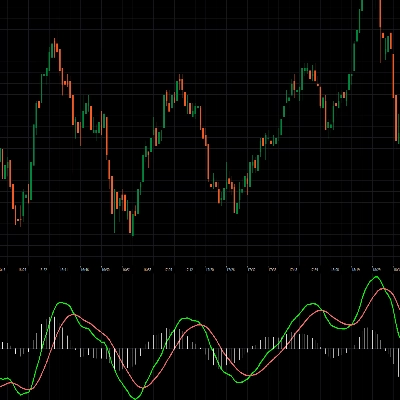
Step 1: Traditional RSI
The standard Relative Strength Index (RSI) is calculated, measuring the speed and magnitude of price movements over a set period. It oscillates between 0 and 100, identifying overbought conditions (e.g., above 70) and oversold conditions (e.g., below 30). 📊📉📈

Step 2: Dynamic Refinement
The traditional RSI undergoes an advanced smoothing process:

  • second mathematical calculation is applied to the original RSI values (not the price itself).
  • This step creates a more stable version of the RSI, reducing minor fluctuations (market noise) and highlighting genuine trends.
  • Unlike basic smoothing, this method preserves responsiveness to significant momentum shifts, avoiding excessive delays. 🛡️🔄

Why Does the Refinement Matter? 🤩

  • Smart Filtering: Eliminates false signals caused by temporary volatility, such as news spikes or speculative moves. �🗑️
  • Sharper Trends: The dual-calculation approach distinguishes between minor corrections and real trend reversals. 🎯
  • Persistent Signals: Once a trend (bullish/bearish) is confirmed, the indicator holds it until a clear reversal occurs, avoiding erratic signal jumps. 🔒

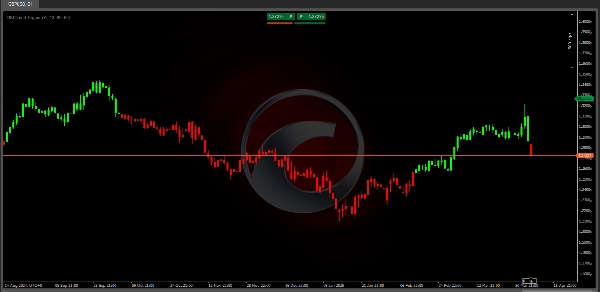
Practical Use: Thresholds & Decision-Making 📈

The refined RSI combines with two adjustable thresholds:

  1. Bullish Threshold (e.g., 60):
    • If the refined RSI crosses above this level, a bullish trend is confirmed. 🚀
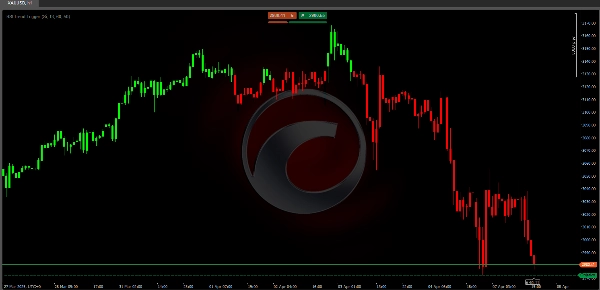
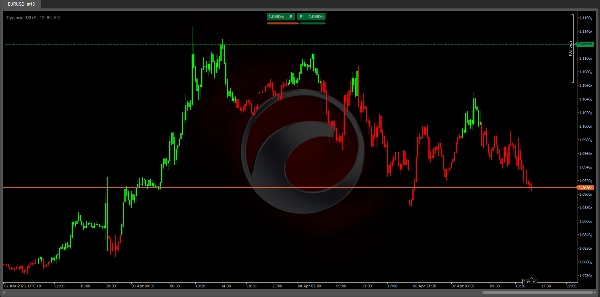
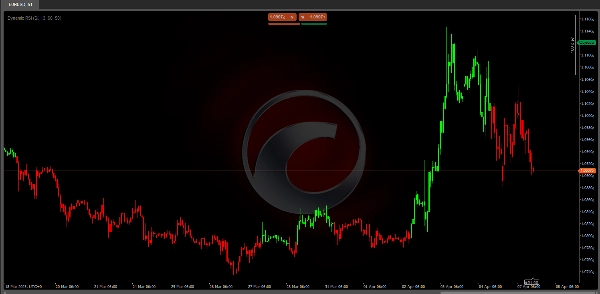
    • Candles turn green
  2. Bearish Threshold (e.g., 50):
    • If the refined RSI drops below this level, a bearish trend is triggered. 📉
    • Candles turn red

Key Rule:

  • Signals only appear during trend changes (not on every fluctuation), reducing information overload. 🚫📢
  • Thresholds are customizable: use higher values (e.g., 65/55) for volatile markets or lower values (e.g., 55/45) for smoother trends. ⚙️

Benefits for Traders 🏆

  1. Enhanced Precision:
    • Fewer false signals thanks to dual-layer filtering. Ideal for sideways markets or fakeouts. ✅
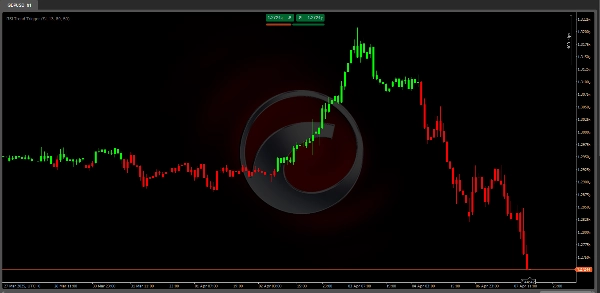
  2. Intuitive Visualization:
    • Colored candles and visual thresholds let you spot trends instantly. 👀🎨
  3. Adaptability:
    • Works across assets (forex, stocks, crypto) and timeframes (minutes to weeks). 🌍⏳
  4. Trend-Focused Trading:
    • Helps trade with the momentum, avoiding risky counter-trend moves. 🎯🚦

Example Signal Flow

Imagine the refined RSI is at 55 (neutral zone):

  • Bullish Scenario: Rises to 62 → Crosses the 60 threshold → Candles turn green🚀
  • Bearish Scenario: Drops to 48 → Breaks the 50 threshold → Candles turn red📉


4.6
Reviews: 3
5
67 %
4
33 %
3
0 %
2
0 %
1
0 %
Customer reviews
November 12, 2025
Could have the option to change colors at least. But the idea is good.
October 4, 2025
I like it, but , take care about, place, conoslidation, down and up trend. NIce
August 12, 2025
Pros: Reliable trend filter based on RSI crossing customizable levels (e.g. 50). Lightweight and fast. Ideal for trend-following setups. Cons: No tooltips, alerts, or preset management. Needs confirmation via volume or price action to avoid false triggers.
More from this author
Indicator
RSI
Breakout
XAUUSD
+6
ZigZag
ZigZag filters noise, spots trends, patterns, pivots, aiding analysis, trade management, and confirmations. 📉📈
Indicator
RSI
Breakout
XAUUSD
+6
Order Block
Identify bullish and bearish Order Blocks to spot key support/resistance levels and potential trend reversals! 📈🔄
Indicator
RSI
Breakout
XAUUSD
+5
Auto-Trend Channel
Adaptive trend channel using linear regression and Pearson correlation for dynamic support, resistance, and trends.
Indicator
RSI
XAUUSD
Breakout
+5
BOS & CHOCH
Market structural patterns , specifically the concepts of Change of Character (ChoCH) 🔄 and Break of Structure (BoS) 💥
Indicator
RSI
Breakout
XAUUSD
+6
Volume POC Heatmap
📊 Shows volume by price levels, highlights POC, and key zones. Identifies dynamic support/resistance and imbalances.
Indicator
RSI
Breakout
Supertrend
All Support and Resistance Levels
"Identify key market zones and visualize support/resistance from multiple timeframes on a single chart.
Indicator
RSI
Breakout
XAUUSD
+5
Zones Supply Demand
📊Zones Supply & Demand: Identifies key price levels with high volume concentration, marking Supply/Demand Zones & Marke
Indicator
RSI
Breakout
XAUUSD
+5
Supertrend
💹 Define a price channel 📈 and determine trend direction (bullish 🟢 or bearish 🔴).
Indicator
RSI
Breakout
XAUUSD
+6
Fair Value Gap Sessions
identify and highlight temporary market inefficiencies known as "fair value gaps" 🚨 within specific trading Sessions.
Indicator
RSI
Breakout
XAUUSD
+4
Dynamic Market Structure Analysis of Turning Points
Identify market structure effortlessly with swing highs, lows, CHoCH, and BOS levels for smart trading decisions! 📊🔍"
Indicator
Indices
RSI
XAUUSD
+7
RSI Divergence
Detects bullish and bearish divergences
Advanced Market Structure Bos,Choch,SwinLevels, Order Blog
Advanced price action tool that combines multiple technical analysis concepts
Indicator
RSI
Breakout
Supertrend
Swing Levels
🔍 Automatically detect support and resistance levels based on "swings" or pivots
Indicator
RSI
Breakout
Supertrend
Trend Heikin Multi MA
🚀 TrendHeikinMultiMA: Advanced trend detection using Heikin-Ashi smoothing & MAs! Eliminates noise, confirms real trend
Indicator
RSI
Breakout
XAUUSD
+4
Multi-Level Candle Bias Tracker
Price direction by calculating the probability of reaching new highs/lows. Shows levels & stats📈
Indicator
RSI
Breakout
Supertrend
Leverage Liquidation Map
📊 Liquidation Map: Potential areas where highly leveraged investors might face liquidations.
Indicator
RSI
XAUUSD
Breakout
+4
ICT Power of 3
🎯 Auto-plots key zones (Accumulation, Manipulation, Distribution) . Reveals institutional traps & trends.
Indicator
NAS100
NZDUSD
XAUUSD
+9
PineScriptLabs Smart Signals CDRC Auto TPSL
🎯Smart Signals : Auto Buy/Sell alerts with dynamic TP/SL algorithm. 💡
You may also like
Indicator
NAS100
RSI
NZDUSD
+13
RSI
RSI Pro Tool – Overbought & Oversold Made Easy
LaguerreRSI
Laguerre RSI: smoother, faster RSI with less noise. Great for spotting reversals and timing entries.
Indicator
VWAP
Indices
Forex
TPO Profile v2.0
TPO Profile v2.0
Indicator
Breakout
Fibonacci
Initial Balance
Track Initial Balance ranges across any period with optional Fibonacci levels and projections.
Indicator
Indices
Prop
Stocks
+3
Market Sessions Advanced
Advanced Market Sessions with ICT killzones
Indicator
NAS100
NZDUSD
Martingale
+24
LookPosOrderIndicator
On-chart draggable panel to show/hide Positions & Pending Orders with fixed warning banner and inline alerts per symbol.
Indicator
Signal
FractalArrowBuySell
Fractal Arrow Buy and Sell Indicator
Volume Efficiency Analyzer
Analyzes volume efficiency and market quality. Measures effort vs result to identify decisive or exhausted moves.
Indicator
NAS100
NZDUSD
Martingale
+22
Candle Timer
Candle Timer best used for Scalper
Indicator
NAS100
NZDUSD
XAUUSD
+14
Donchian Channel Pro
Tracks N-period highs/lows, HTF overlay, HUDs with ADX, RSI, session clocks. Customizable for precise trading.
Indicator
NAS100
NZDUSD
XAUUSD
+12
Coral Filter Lite
🐠 Free trend baseline - without the noise. Free limited version of Coral Filter X Pro 🐠
Indicator
NAS100
NZDUSD
Martingale
+26
FIBONACCI Volume Delta Indicator
A Clear Fibonacci Map for Smarter Decisions.
TraderMaxBBflterXDemo-
TraderMax BB Filter X (DEMO) for cTrader 🧪 Limited-Time Demo Version (24h) TraderMax BB Filter X (DEMO) is a precision
Supertrend TV
REAL Supertrend because default Ctrader Supertrend gives different signals
Indicator
NAS100
NZDUSD
XAUUSD
+12
WT - Amplitude - Momentum Detection
Experience a new approach with amplitude-based momentum analysis. Smart Trend Detection That Adapts to Market Volatility
Vsamarth Indi
One‑click RSI robot for consistent rapid‑fire trades.
Indicator
Indices
RSI
Breakout
+6
ZigZagColor
The ZigZag indicator is a technical analysis tool primarily used to identify key price reversal points.
Indicator
Indices
RSI
Bollinger
Clustering
Clustering tool for traders with visual insights into market patterns.