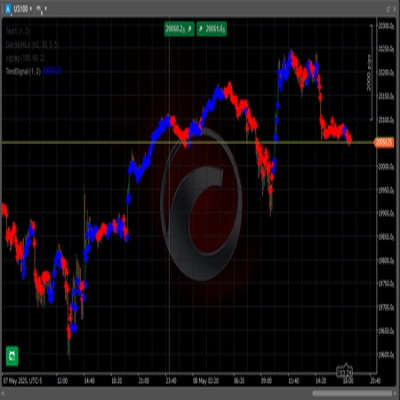
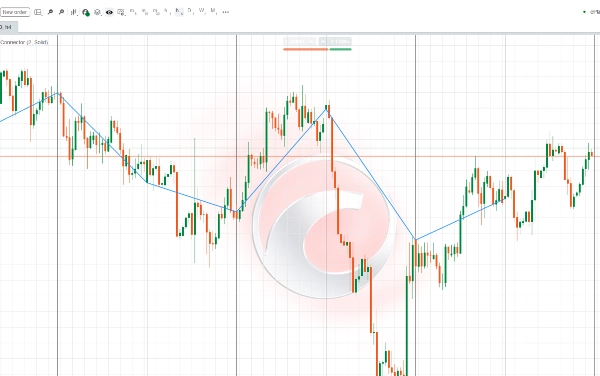
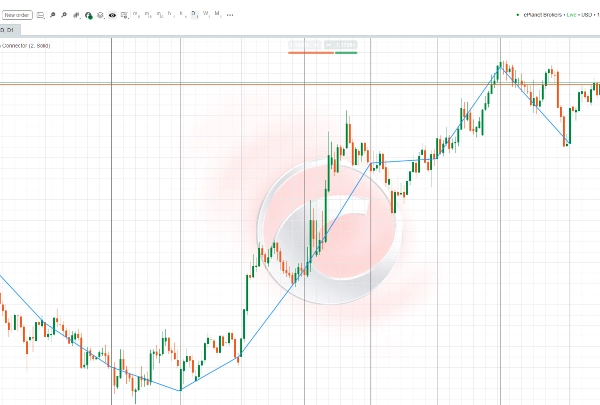
Brokers & props
For business
00
Days
:
00
Hours
:
00
Minutes
:
00
Seconds
IR Open Connector
"IR Open Connector" logo
Since 23/01/2025
Free installs
3933
"IR Open Connector" uploaded image"IR Open Connector" uploaded image

IR Open Connector
This indicator is designed to connect the opening prices of higher timeframe candles, depending on the current chart timeframe:

  • If the timeframe is below one hour → connects the opens of Daily candles.
  • If the timeframe is 4 hours → connects the opens of Weekly candles.
  • If the timeframe is higher than 4 hours but lower than Weekly → connects the opens of Monthly candles.

This allows traders to clearly visualize the key opening levels of higher periods (Daily, Weekly, Monthly) directly on their charts. These levels often serve as critical areas of support and resistance, potential trend initiation zones, and important reference points in market analysis.

The line color, thickness, and style are fully customizable, giving you flexibility to adapt the display to your personal trading style.


این اندیکاتور طراحی شده تا نقاط باز شدن کندل‌های تایم‌فریم‌های بالاتر را بسته به تایم‌فریم فعلی شما به هم متصل کند:

  • اگر تایم‌فریم کمتر از یک ساعت باشد → باز شدن کندل‌های روزانه را به هم وصل می‌کند.
  • اگر تایم‌فریم چهارساعته باشد → باز شدن کندل‌های هفتگی را به هم وصل می‌کند.
  • اگر تایم‌فریم بزرگتر از چهارساعته و کوچکتر از هفتگی باشد → باز شدن کندل‌های ماهانه را به هم وصل می‌کند.

این ویژگی به معامله‌گر کمک می‌کند تا به سادگی سطوح مهم شروع دوره‌های بزرگ‌تر (روزانه، هفتگی، ماهانه) را روی نمودار مشاهده کند. این سطوح اغلب به‌عنوان نقاط کلیدی حمایت و مقاومت، شروع روندهای جدید یا محدوده‌های معاملاتی مهم در نظر گرفته می‌شوند.

با تنظیم رنگ، ضخامت و نوع خط، می‌توانید نمایش این خطوط را مطابق با سبک معاملاتی خود شخصی‌سازی کنید.

0.0
Reviews: 0
Customer reviews
No reviews for this product yet. Already tried it? Be the first to tell others!
More from this author
IR Candle MTF
with this indicator you could see other time frame candle in your chart.
IR Spread
show spread on chart
IR Macd + MacdLine
some user add moving average to macd to see better. in ctrader 4.3.11 there is a problem with this . I make a macd tha
IR Macd on Chart
this indicator show macd on chart.
IR Moving Average
 this moving include everything that a trader needs from Moving Average.
IR Ichimoku Macd
this indicaotr show distance between Tenkan to Kijun, Close to Kijun and Close to Tenkan 
IR Slowing Moving
Add Slowing to IR Moving Average.
IR Moving MTF
multi time frame moving averge. you could choose different type of price like median ,high and ... and differnt type of
IR Coral
Coral indicator
IR CheckList
you could put your check list in your chart you could split your test with “,” you could put your checklist in indicat
IR Multi Data
show symbol and time fram, daily net profit percent, daily net profit, and spread ln your chart. consider that timezone
IR Close MTF
this indicator show other time frame close in lower time frame. for ex: show daily close in m 15.
IR VLine
don't move to the end of chart after timeframe changing. it should be better to use for near history. for long history
IR Candle Open
IR Candle Open plots customizable opening price lines for daily, weekly, and monthly candles
You may also like
LDE - Market Sessions
🇫🇷 Visualisez vos sessions de marché et OPR d'un coup d’œil 🇬🇧 Visualize your market sessions & OPR at a glance !
Indicator
Indices
Commodities
CCI - With Arrows and 40 80 EMA Logic_noSourceCode
The Advanced CCI & EMA Indicator combines the CCI with 40 & 80 EMA logic to generate precise arrows signaling direction
Daily Sessions HighLow Helper
Shows daily and sessions highs / lows and session boxes, everything configurable
Indicator
RSI
Breakout
XAUUSD
+12
Liquidity Pressure Index
Liquidity Pressure Index is a tool that gives traders deeper insights into the hidden dynamics of market liquidity
Indicator
Indices
ADXMultiframeIndicator
Multi-Timeframe ADX Trend Dots & Arrows
Indicator
NAS100
NZDUSD
Breakout
+13
KeyLevels
Key Levels Indicator – Automatically plots monthly, weekly, and daily highs/lows with customizable colors & styles
Indicator
Indices
Breakout
Forex
+2
Time zone pro
FREE Global Trading Sessions Indicator
xhobaniFX_ADR-Lines
xhobaniFX_ADR-Lines: Average Daily Range Horizontal Lines
Indicator
XAUUSD
Martingale
Commodities
+2
cAlgoBuddy - Zone Recovery
The Zone Recovery indicator is used in an advanced hedging strategy, opening traders in the opposite direction.
Quantitative Qualitative Estimation
The QQE (Quantitative Qualitative Estimation) Weighted Oscillator improves its original version by weighting the RSI.
Indicator
Grid
Breakout
XAUUSD
+10
Ultimate Trend ADX
Download Ultimate Trend ADX today and experience a smarter way to track market trends completely free on ctrader
Open Trade PipsV1
This indicator tracks the unrealised amount of pips in your open positions.
Order Block Detector SmartTrading
🎯 Order Block Detector - Smart Trading: Identifica bloques de órdenes clave en cTrader para un trading más inteligente.
Indicator
RSI
Breakout
XAUUSD
+5
Prediction Based on Linreg & ATR
📊Predicts price movement by combining multi-timeframe trend analysis, market volatility 📉, and..
SmartArrows AI V2
High-Performance Renko Chart Indicator with Advanced AI Filtering.
MAMA CANDLES
This code implements the MESA Adaptive Moving Average (MAMA) indicator, it creates candles based on MAMA calculations.
Parabolic RSI Alert  V1
Master RSI reversals with Parabolic SAR precision! Get real-time alerts for high-probability trend changes.
CRT Pattern Indicator
The CRT indicator helps ICT traders identify candlestick patterns, enhancing analysis of higher timeframe on lower