Brokers & props
For business
00
Days
:
00
Hours
:
00
Minutes
:
00
Seconds
IR Candle Open
"IR Candle Open" logo
Since 23/01/2025
Free installs
4057
"IR Candle Open" uploaded image"IR Candle Open" uploaded image

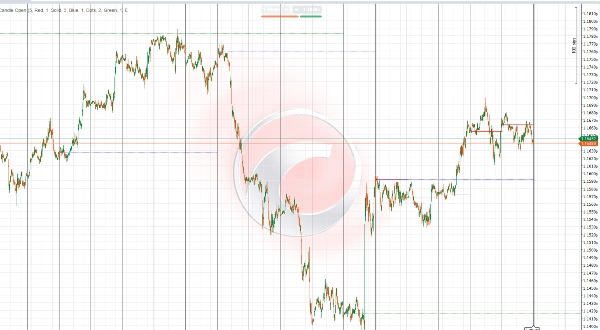
IR Candle Open Indicator is a versatile and customizable tool that plots the opening prices of weekly, daily, and monthly candles on your trading chart. Traders can select the number of periods (days, weeks, months) to display, enabling flexible multi-timeframe analysis tailored to their strategy.

Key features include:

  • Precise plotting of candle opens for user-defined numbers of daily, weekly, and monthly periods.
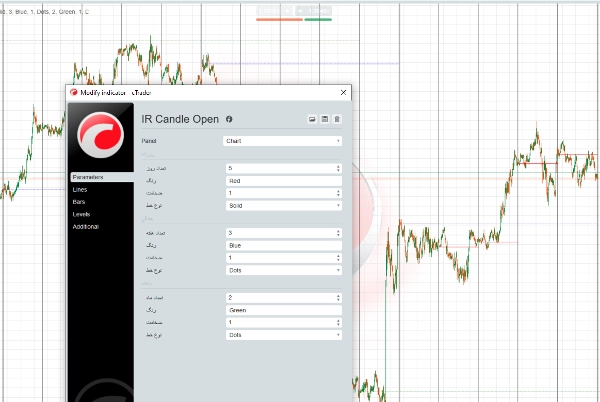
  • Customizable line styles: users can choose line type (solid, dashed, dotted), color, and thickness for better chart readability.
  • Supports multi-timeframe visualization to help identify important price levels across different time horizons.
  • Assists in spotting potential support and resistance zones based on these critical opening prices.
  • Compatible with various markets such as Forex, commodities, indices, and cryptocurrencies.

This flexibility empowers traders to adapt the indicator’s display to their personal preferences and trading style, enhancing clarity and improving decision-making based on crucial price levels.


توضیح فارسی (به‌روز شده)

اندیکاتور IR Candle Open ابزاری منعطف و قابل تنظیم است که قیمت‌های باز شدن کندل‌های هفتگی، روزانه و ماهیانه را روی نمودار معاملاتی شما نمایش می‌دهد. کاربران می‌توانند تعداد دوره‌های روزانه، هفتگی و ماهیانه که می‌خواهند خطوط آن‌ها نمایش داده شود را انتخاب کنند تا تحلیل چندتایم‌فریمی متناسب با سبک معاملاتی خود داشته باشند.

ویژگی‌های کلیدی:

  • نمایش دقیق خطوط قیمت باز شدن کندل‌ها برای تعداد دوره‌های دلخواه در تایم‌فریم‌های روزانه، هفتگی و ماهیانه.
  • امکان انتخاب نوع خط (ساده، خط‌چین، نقطه‌چین)، رنگ و ضخامت خطوط برای بهبود وضوح و خوانایی نمودار.
  • پشتیبانی از تحلیل چندتایم‌فریمی جهت شناسایی سطوح مهم قیمتی در بازه‌های زمانی مختلف.
  • کمک به تشخیص سطوح حمایت و مقاومت احتمالی بر اساس این نقاط کلیدی باز شدن قیمت‌ها.
  • مناسب برای استفاده در بازارهای مختلف مانند فارکس، کالاها، شاخص‌ها و رمزارزها.

این قابلیت‌ها به تریدرها امکان می‌دهد تا نمایش اندیکاتور را بر اساس سلیقه و سبک معاملاتی خود تنظیم کنند و با وضوح بیشتر، تصمیمات بهتری بگیرند.

5.0
Reviews: 1
5
100 %
4
0 %
3
0 %
2
0 %
1
0 %
Customer reviews
November 18, 2025
More from this author
IR Candle MTF
with this indicator you could see other time frame candle in your chart.
IR Spread
show spread on chart
IR Macd + MacdLine
some user add moving average to macd to see better. in ctrader 4.3.11 there is a problem with this . I make a macd tha
IR Macd on Chart
this indicator show macd on chart.
IR Moving Average
 this moving include everything that a trader needs from Moving Average.
IR Ichimoku Macd
this indicaotr show distance between Tenkan to Kijun, Close to Kijun and Close to Tenkan 
IR Slowing Moving
Add Slowing to IR Moving Average.
IR Moving MTF
multi time frame moving averge. you could choose different type of price like median ,high and ... and differnt type of
IR Coral
Coral indicator
IR CheckList
you could put your check list in your chart you could split your test with “,” you could put your checklist in indicat
IR Multi Data
show symbol and time fram, daily net profit percent, daily net profit, and spread ln your chart. consider that timezone
IR Close MTF
this indicator show other time frame close in lower time frame. for ex: show daily close in m 15.
IR VLine
don't move to the end of chart after timeframe changing. it should be better to use for near history. for long history
IR Open Connector
This indicator connects the opening prices of higher timeframe candles (Daily, Weekly, Monthly, or
You may also like
Indicator
Prop
Commodities
Stocks
+2
Light-Version BrickAlgo TrendPulse
🚀 Simplify Your Trading Decisions With Powerful Technical Analysis.
IR Coral
Coral indicator
Indicator
NAS100
XAUUSD
Forex
+3
Linear Regression Oscillator
The Linear Regression Oscillator (LRO) is a technical indicator based on linear regression analysis.
Indicator
NAS100
NZDUSD
Martingale
+23
Elliott Waves Auto Detection + Fibonacci
Auto-detect Elliott 1–5 & a–b–c waves with smart Fib zones, boxed labels, and breakout boxes—ready to trade.
Indicator
RSI
Breakout
Signal
+1
Dynamic Trend Gradient
Identifies trends with moving averages & volatility. Base levels = bullish 🐂 or bearish 🐻 signals. Reversals detected!
Indicator
Signal
Scalping
9-5-3 Trading Strat
Enhance Your Trading Strategy with the Larry Williams 9-5-3 Indicator
Indicator
Breakout
Scalping
KAMAKeltner
KAMA Keltner – Adaptive Volatility Channel for Precision Trading
Session Highlight Framer
Frame the sessions
TDI_Pro
Traders Dynamic Index (TDI) — Divergence Edition
Indicator
NAS100
NZDUSD
XAUUSD
+12
FVG_Bruno
Fair Value Gap (FVG) indicator identifies price inefficiencies in the market by highlighting gaps between candlesticks.
Indicator
NAS100
NZDUSD
XAUUSD
+14
VMM Signals Average Pro Trial
VmmSignalAverage PRO Trial - Professional Pattern Detection Indicator
Indicator
RSI
Breakout
XAUUSD
+5
Trailing Smart Algorithm
Trailing algo 📈 auto-tracks trends 🎯 adapts to volatility 🌟 precise moves 🛡️ retest signals 🚀 no lag, smart market
Indicator
NAS100
Indices
XAUUSD
+9
HAIQuantum_TheGameV2
This trading game allows you to explore and practice investment strategies in a real-time market data environment.
Indicator
Grid
NAS100
NZDUSD
+18
SmartFractalZigZagPlus
Smart fractals + auto Fibonacci + dynamic S/R zones with HTF confluence & Bull/Bear bias panel. Institutional-grade.
Indicator
Grid
NAS100
NZDUSD
+6
Volume Break Structure
🎯Identify zones of HIGH INSTITUTIONAL INTEREST: Where there is MORE VOLUME in the breaks, there is GREATER PARTICIPAT..
Head Shoulders Finder
Detects Head & Shoulders patterns, plots signals, and alerts for trading opportunities.
Indicator
NAS100
NZDUSD
Martingale
+26
Info Dashboard_noSourceCode
Read the market with AI: live sentiment, news impact, equity, spread & neural net signals in one dashboard.