
Tracking Performance by Quantara
Indicator
30 downloads
Version 1.0, Feb 2026
Windows, Mac
Description
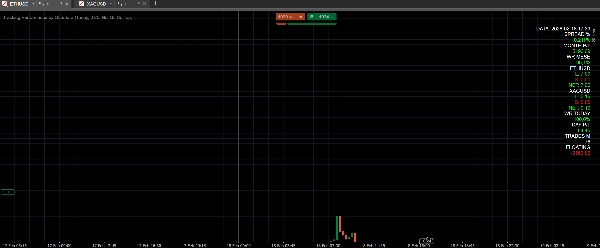
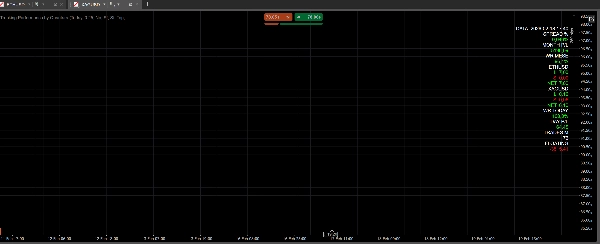
Tracking Perfromance by Quantara is a dashboard indicator that displays real‑time performance metrics and per‑asset exposure.
It shows: monthly and daily P/L, monthly and daily win rate, monthly trade count, floating P/L, spread in percentage, and long/short/net for each open asset.
All values are color‑coded for quick reading (positive/negative P/L, win‑rate thresholds, long green, short red).
What it calculates/displays
- Spread % (with different thresholds for metals and crypto)
- Monthly and daily P/L
- Monthly and daily win rate
- Monthly trade count
- Floating P/L
- Per‑asset exposure (long / short / net)
Recommended instruments/timeframes
- Works on any instrument and any timeframe
- Suggested on main charts (M15–H4) for daily monitoring
How to use
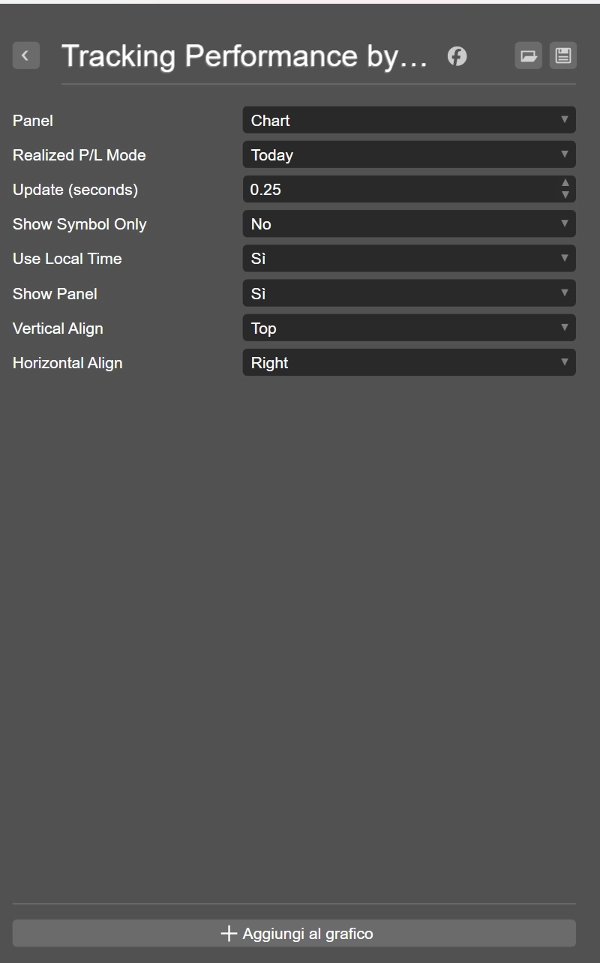
- Add the indicator to a chart
- Set the update interval (Update seconds)
- Use Show Panel to toggle visibility
- Use “Show Symbol Only” to filter to the chart symbol
- Use “Use Local Time” to apply local time filters
Key parameters
- Update (seconds): refresh frequency
- Show Symbol Only: display only the chart symbol
- Use Local Time: use local time for filters
- Show Panel: show/hide the panel
- Vertical/Horizontal Align: panel placement
Use cases
- Quick check of net exposure per asset
- Daily and monthly performance tracking
- Win‑rate monitoring for operational quality
- Spread % monitoring for metals and crypto
Disclaimer
Trading involves risk. Past performance does not guarantee future results.
Summary
AI summary
Tracking Performance by Quantara is a dashboard indicator designed for real-time monitoring of trading performance across multiple assets. It provides key metrics including monthly and daily profit and loss (P/L), win rate, trade count, floating P/L, and spread percentage, with specific thresholds for metals and cryptocurrencies. The indicator also displays per-asset exposure categorized as long, short, or net positions. All values are dynamically color-coded to facilitate quick interpretation, highlighting positive/negative P/L, win-rate levels, and position types.
This tool is compatible with any trading instrument and timeframe, with a recommendation for use on main charts ranging from 15-minute to 4-hour intervals for daily performance tracking. Users can customize update frequency, toggle panel visibility, filter data to the current chart symbol, and apply local time settings. The indicator supports quick assessment of net exposure, daily and monthly performance, win-rate monitoring, and spread percentage analysis for metals and crypto markets.
Key parameters include update interval, symbol filtering, local time usage, panel display options, and panel alignment. This indicator is applicable across Forex, Indices, Commodities, Crypto, and Stocks markets.
Indicator profile
Customer reviews
0.0
Reviews: 0
Customer reviews
No reviews for this product yet. Already tried it? Be the first to tell others!
Discussion
FAQ
Forex
Indices
Commodities
Crypto
Stocks
Products available through cTrader Store, including trading bots, indicators and plugins, are provided by third-party developers and made available for informational and technical access purposes only. cTrader Store is not a broker and does not provide investment advice, personal recommendations or any guarantee of future performance.


Price
Since 29/01/2026
30
Free installs