
Aggressive Entry Momentum MACD Power Guide
Indicator
3 purchases
Version 1.0, Nov 2025
Windows, Mac
5.0
Reviews: 1
Description
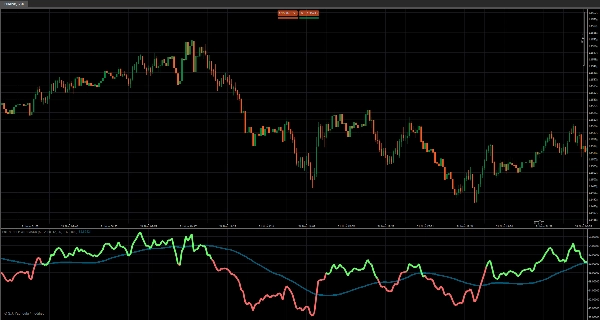
This indicator is built for traders who want raw power, instant momentum clarity, and zero hesitation in their entries.
By combining RSI-EMA smoothing, a dynamic SMA baseline, and MACD-driven color momentum, it exposes bullish and bearish strength with ruthless precision.
Every segment of the RSI-EMA line lights up Lime in aggressive bullish momentum and Tomato when bearish pressure takes control, giving you a fast, undeniable read on direction.
Use it directly in a separate panel for a clean momentum window, or drag it onto the main chart to blend price action with momentum strength in one strike.
Designed for traders who demand decisive signals, sharp momentum shifts, and a tool that cuts through noise instantly.
Summary
AI summary
The Aggressive Entry Momentum MACD Power Guide is a trading indicator designed to provide clear and immediate momentum signals for entry decisions. It combines RSI-EMA smoothing, a dynamic SMA baseline, and MACD-based color momentum to highlight bullish and bearish strength precisely. The indicator visually signals aggressive bullish momentum with lime-colored segments and bearish pressure with tomato-colored segments on the RSI-EMA line. It can be displayed in a separate panel for a focused momentum view or overlaid on the main price chart to integrate momentum strength with price action. This tool supports various markets including indices, commodities, forex, stocks, and cryptocurrencies, and is applicable to multiple symbols such as GBPUSD, EURUSD, XAUUSD, BTCUSD, and NAS100. It is suited for traders seeking decisive and rapid momentum shifts to guide entry points.
Indicator profile
Customer reviews
5.0
Reviews: 1
5 | 100 % | |
4 | 0 % | |
3 | 0 % | |
2 | 0 % | |
1 | 0 % |
Customer reviews
December 1, 2025
2 timeframes keeps the first run grounded. The opening read should not drive the only input.
Discussion
FAQ
Signal
Indices
Commodities
GBPUSD
RSI
Bollinger
Fibonacci
Scalping
AI
XAUUSD
NAS100
MACD
BTCUSD
Forex
Breakout
EURUSD
NZDUSD
Martingale
Prop
ZigZag
Supertrend
Fair Value Gap
Crypto
Grid
Stocks
ATR
USDJPY
VWAP
Products available through cTrader Store, including trading bots, indicators and plugins, are provided by third-party developers and made available for informational and technical access purposes only. cTrader Store is not a broker and does not provide investment advice, personal recommendations or any guarantee of future performance.


!["[Hamster-Coder] Moving Average MTF" logo](https://cdn.ctrader.com/image/webp/b11b98b1-194d-4b8e-b00e-d611826ad159_31226)


Price
60
Sales
932
Free installs