Description
SR Commander
Free trial Big Brother: SR Commander Multi Timeframe https://ctrader.com/products/3833?u=ALGO-XL
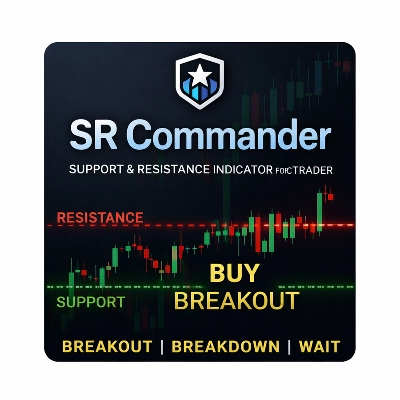
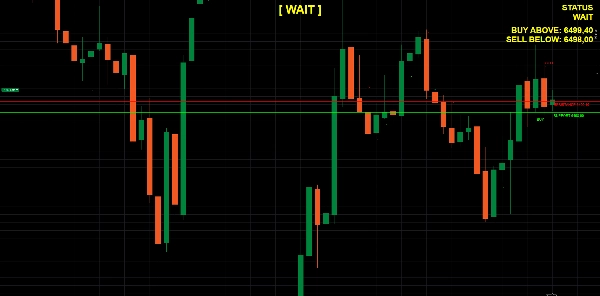
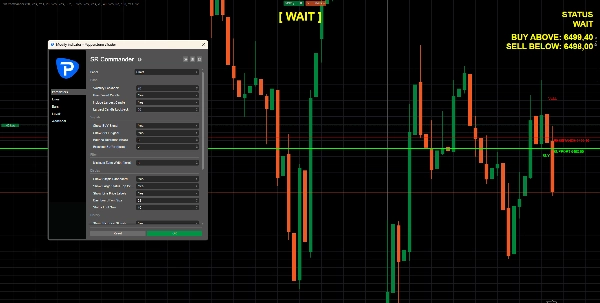
SR Commander is a clean and intelligent support and resistance indicator for cTrader, built to help traders identify key market levels, read price location instantly, and react faster to breakout, breakdown, and rejection scenarios.
Instead of cluttering the chart with unnecessary noise, SR Commander focuses on what matters most: the nearest actionable support and resistance levels around the current price, combined with a simple visual status system that tells you whether the market is in a BUY, SELL, or WAIT condition.
This makes it especially useful for traders who want a fast, structured view of market behavior without having to manually mark levels on every chart.
How SR Commander works
SR Commander scans recent price action and identifies the most important candles within the selected lookback logic. It combines this with a volatility-based calculation to build meaningful support and resistance levels around the current market price.
From those detected levels, the indicator automatically selects the nearest support below price and the nearest resistance above price. These levels are then drawn directly on the chart as clear horizontal lines, giving you an immediate understanding of where price is currently positioned inside the market structure.
Once these levels are established, SR Commander evaluates the current market condition:
- BUY / BREAKOUT
If price closes above the nearest resistance level, with an adjustable breakout buffer, the indicator interprets this as a bullish breakout. - SELL / BREAKDOWN
If price closes below the nearest support level, with an adjustable breakdown threshold, the indicator interprets this as a bearish breakdown. - WAIT
If price remains between support and resistance, the indicator signals that the market is still inside the range and no clear directional break has occurred.
This logic helps traders avoid emotional decision-making and gives a more objective framework for reading market structure.
Built for real chart decision-making
SR Commander is not just about drawing lines. It is designed to help traders understand what price is doing at those lines.
In addition to detecting breakout and breakdown conditions, the indicator can also identify:
- Buy bounce signals when price tests support and closes back above it with bullish confirmation
- Sell rejection signals when price tests resistance and closes back below it with bearish confirmation
- Historical breakout and breakdown markers so previous market reactions can be reviewed directly on the chart
- Optional historical buy and sell reaction points for traders who want to study past support/resistance behavior
This makes SR Commander useful not only for live analysis, but also for chart review, pattern recognition, and trade journaling.
Clean visual structure
One of the strengths of SR Commander is its simplicity. The indicator is designed to stay visually clear while still delivering critical information.
It can display:
- The nearest support and resistance levels
- Optional price labels on the lines
- A compact dashboard showing the current market condition
- A large central status message such as BUY, SELL, or WAIT
- Historical symbols for past breakout and breakdown events
The result is a chart that stays readable and efficient, even during active market conditions.
Smart filtering logic
SR Commander also includes practical filters to improve signal quality.
For example, the indicator can ignore situations where the distance between support and resistance is too small. When the current zone becomes too narrow, the market may be too compressed or unclear for meaningful decision-making. In such cases, the indicator returns a WAIT condition rather than forcing a low-quality signal.
This helps reduce false triggers and keeps the focus on cleaner trading opportunities.
Key features
- Automatically detects relevant support and resistance levels
- Highlights the nearest actionable levels around current price
- Identifies BREAKOUT, BREAKDOWN, and WAIT market states
- Optional BUY bounce and SELL rejection signals
- Historical breakout and breakdown visualization
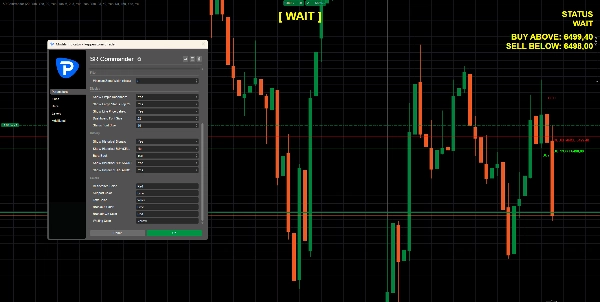
- Adjustable breakout buffer and bounce tolerance
- Optional use of closed candle confirmation
- Clean dashboard and large status display
- Simple visual layout for fast chart reading
Who this indicator is for
SR Commander is suitable for traders who rely on price structure and level-based decision-making, including:
- breakout traders
- price action traders
- intraday traders
- swing traders
- discretionary traders who want cleaner chart structure
- traders looking for quick visual confirmation around support and resistance
Whether you trade reversals, retests, range breaks, or continuation moves, SR Commander helps you stay focused on the most important levels on the chart.
Why use SR Commander
Markets often become confusing when too many indicators are competing for attention. SR Commander solves that problem by giving traders a structured and readable view of the market through one of the most important concepts in technical analysis: support and resistance.
By combining level detection, volatility-aware logic, bounce/rejection recognition, and breakout status in one clean tool, SR Commander helps traders answer three essential questions quickly:
- Where is price right now?
- Is the market breaking out, breaking down, or still ranging?
- Is price reacting with strength or rejection at key levels?
This creates a more disciplined workflow and allows traders to make decisions with more clarity and less chart noise.
Important note
SR Commander is designed as a decision-support tool for technical analysis. It does not guarantee winning trades and should always be used alongside your own market context, confirmation methods, and risk management rules.
Summary
SR Commander identifies breakout and breakdown scenarios when price closes beyond the nearest resistance or support levels, respectively, with adjustable buffers. It also signals buy bounces and sell rejections when price tests and reacts to these levels. Historical breakout and breakdown events are marked on the chart for review and pattern recognition.
The indicator features smart filtering to avoid low-quality signals, such as ignoring zones where support and resistance are too close. Its clean visual layout includes optional price labels, a large status message, and historical reaction points, facilitating fast and structured market analysis.
SR Commander supports traders focusing on price structure and level-based strategies, including breakout, price action, intraday, and swing trading across various markets such as forex, indices, commodities, stocks, and cryptocurrencies. It serves as a decision-support tool to enhance clarity and reduce chart noise in technical analysis.














!["[Stellar Strategies] Inside Bar with Signals" logo](https://cdn.ctrader.com/image/webp/1d9e8bfa-3b2c-4440-bb37-5856902008a7_30683)