
คำอธิบาย
WICK COMMANDER — รู้ได้อย่างชัดเจนเมื่อใดที่ตลาดตัดสินใจ
เทรดเดอร์ส่วนใหญ่ดูแท่งเทียน Wick Commander ดูที่ เจตนา.
แท่งเทียนแต่ละแท่งบอกเล่าเรื่องราว — แต่เป็นการปิดแท่งเทียนที่เปิดเผยความจริง Wick Commander ติดตามจุดสูงสุดและต่ำสุดของแท่งเทียนก่อนหน้าและรอให้ราคาปิด เกิน ช่วงนั้นด้วยความมั่นใจ ไม่มีการหลอกด้วยไส้เทียน ไม่มีเสียงรบกวน มีแต่การเบรกเอาต์ที่ได้รับการยืนยันโดยการปิดแท่งเทียนเต็มรูปแบบเท่านั้น
วิธีการทำงาน
ตรรกะนี้คมชัดเหมือนใบมีด:
สัญญาณ ซื้อ จะทำงานเมื่อแท่งเทียนขาขึ้นปิด เหนือ จุดสูงสุดของแท่งเทียนก่อนหน้า — ราคานั้นไม่ได้แค่แตะผ่าน แต่ได้ตัดสินใจแล้ว สัญญาณ ขาย จะทำงานเมื่อแท่งเทียนขาลงปิด ต่ำกว่า จุดต่ำสุดของแท่งเทียนก่อนหน้า — ผู้ขายได้ควบคุมเต็มที่
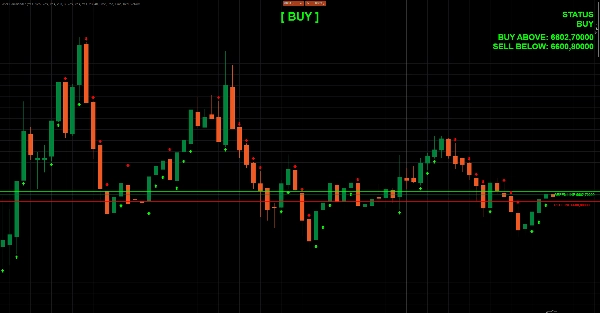
เส้นไดนามิกสองเส้นอัปเดตแบบเรียลไทม์บนกราฟของคุณ เส้น สีเขียว แสดงระดับเบรกเอาต์ขึ้นด้านบน เส้น สีแดง แสดงระดับเบรกดาวน์ลงด้านล่าง เมื่อราคาปิดเกินเส้นใดเส้นหนึ่งพร้อมทิศทางแท่งเทียนที่ถูกต้อง ลูกศรจะปรากฏและแดชบอร์ดจะอัปเดตทันที
สิ่งที่คุณเห็นบนกราฟ
- 🟢 เส้นสีเขียว — เกณฑ์ซื้อแบบสด (จุดสูงสุดแท่งเทียนก่อนหน้า)
- 🔴 เส้นสีแดง — เกณฑ์ขายแบบสด (จุดต่ำสุดแท่งเทียนก่อนหน้า)
- ⬆️ ลูกศรซื้อ — ปรากฏใต้แท่งสัญญาณในเบรกเอาต์ขาขึ้นที่ได้รับการยืนยัน
- ⬇️ ลูกศรขาย — ปรากฏเหนือแท่งสัญญาณในเบรกดาวน์ขาลงที่ได้รับการยืนยัน
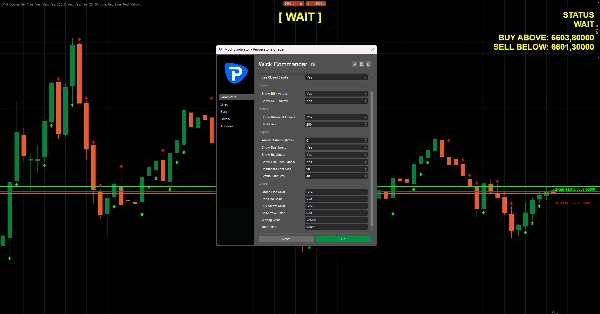
- 📊 แผงแดชบอร์ด — แสดงสถานะปัจจุบัน (ซื้อ / ขาย / รอ), ราคาทริกเกอร์ที่แม่นยำ และอัปเดตทุกแท่ง
- 🔵 จอแสดงสถานะขนาดใหญ่ — ป้ายขนาดใหญ่ตรงกลางแสดงแนวโน้มตลาดปัจจุบันอย่างชัดเจน
- 🕓 การสแกนประวัติเต็มรูปแบบ — ย้อนกลับไปได้ถึง 5000 แท่งเพื่อให้คุณสามารถตรวจสอบคุณภาพสัญญาณบนเครื่องมือและกรอบเวลาของคุณได้ทันที
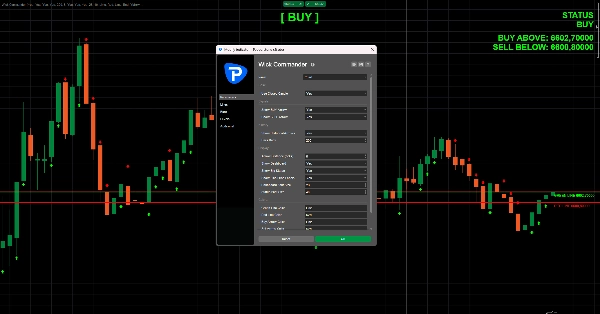
คุณสมบัติ
- ทำงานได้กับทุกกรอบเวลาและทุกเครื่องมือ
- สลับระหว่างโหมดยืนยันแท่งเทียนปิดและโหมดแท่งเทียนสด
- ควบคุมเต็มที่เหนือระยะห่างลูกศร สี ขนาดตัวอักษร และองค์ประกอบการแสดงผล
- ซ้อนสัญญาณประวัติเพื่อทดสอบย้อนหลังทันทีบนกราฟ
- ตรรกะที่สะอาด ไม่มีการทาสีซ้ำ — สัญญาณขึ้นอยู่กับแท่งเทียนที่ปิดแล้วเท่านั้น (เมื่อเปิดโหมดยืนยัน)
- ไม่ต้องใช้ข้อมูลภายนอก ไม่ต้องใช้อินเทอร์เน็ต —
AccessRights.None, เข้ากันได้เต็มที่กับ Store
เหมาะสำหรับใคร?
เทรดเดอร์เบรกเอาต์ เทรดเดอร์โมเมนตัม และใครก็ตามที่เบื่อกับการหลอกลวงของไส้เทียน หากคุณต้องการสัญญาณที่สะอาดและมีหลักเกณฑ์ที่ทำงานเฉพาะเมื่อแท่งเทียน ปิดจริงๆ เกินช่วงก่อนหน้า — Wick Commander คือเครื่องมือของคุณ
กฎง่ายๆ ภาพชัดเจน ไม่มีการเดา
ควบคุมไส้เทียนอย่างเต็มที่.
สรุป
Key features include:
- Real-time dynamic lines on the chart: a green line marking the previous candle’s high (buy threshold) and a red line marking the previous candle’s low (sell threshold).
- Buy signals trigger when a bullish candle closes above the previous high; sell signals trigger when a bearish candle closes below the previous low.
- Visual cues include arrows indicating buy or sell signals and a dashboard panel displaying current market status (BUY, SELL, WAIT) with exact trigger prices.
- A large status display provides an at-a-glance market bias.
- Historical signal overlay allows backtesting up to 5000 bars.
- Customizable display options for arrow distance, colors, and fonts.
- Operates on any timeframe and instrument without external data or internet connection.
- Supports toggle between closed-candle confirmation and live-candle mode with zero repaint logic when confirmation mode is enabled.
Wick Commander is suited for breakout and momentum traders seeking clear, rules-based signals based on candle close confirmations across markets including forex, indices, commodities, stocks, and cryptocurrencies.


