
MACD x Volume Profile
อินดิเคเตอร์
เวอร์ชัน 1.0, Jul 2026
Windows, Mac
ตั้งแต่ 21/02/2026
17.53M
ปริมาณการเทรด
2.85K
Pips ที่ได้กำไร
1
การขาย
คำอธิบาย
MACD x Volume Profile เป็นตัวบ่งชี้แบบโอเวอร์เลย์ที่กำหนดเองสำหรับ cTrader (cAlgo) ซึ่งออกแบบมาเพื่อให้ผู้ซื้อขายมีมุมมองสองด้านเกี่ยวกับแนวโน้มตลาดและสภาพคล่อง โดยการรวมองค์ประกอบพื้นฐานของตัวบ่งชี้ MACD กับ Volume Profile แบบไดนามิก ช่วยให้ผู้ใช้วิเคราะห์โมเมนตัมควบคู่ไปกับโซนการยอมรับราคาประวัติศาสตร์ได้โดยตรงบนแผนภูมิหลัก
คุณสมบัติหลัก:
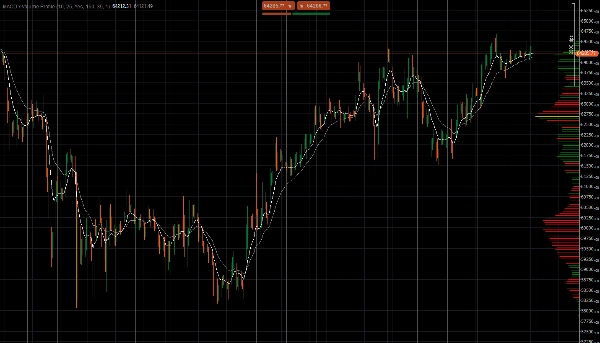
- ค่าเฉลี่ยเคลื่อนที่เลขชี้กำลังคู่ (EMAs): แสดงค่า EMA เร็ว (ค่าเริ่มต้น 10) และ EMA ช้า (ค่าเริ่มต้น 25) โดยตรงบนแผนภูมิราคา การตัดกันและการแยกของเส้นเหล่านี้ช่วยระบุทิศทางแนวโน้มระยะสั้นและระยะยาวรวมถึงโมเมนตัม ซึ่งเป็นพื้นฐานของการวิเคราะห์ MACD มาตรฐาน
- Volume Profile ช่วงที่มองเห็นได้แบบไดนามิก (VRVP): ตัวบ่งชี้จะคำนวณและวาดโปรไฟล์ปริมาณโดย เฉพาะ บาร์ที่มองเห็นได้ในแผนภูมิของคุณในขณะนั้น โดยจะคำนวณใหม่และปรับเปลี่ยนอัตโนมัติเมื่อคุณเลื่อน ซูม หรือปรับขนาดหน้าต่างแผนภูมิ
- การเน้นจุดควบคุม (POC): ระดับราคาที่มีปริมาณการซื้อขายสูงสุด (POC) จะถูกเน้นอย่างชัดเจนด้วยเส้นสีเหลืองที่หนากว่า ช่วยให้คุณระบุพื้นที่สนับสนุนหรือแนวต้านที่แข็งแกร่งที่สุดในมุมมองปัจจุบันได้ทันที
- การระบายสีปริมาณตามทิศทาง: เส้นปริมาณจะถูกระบายสีเพื่อแสดงแรงกดดันในการซื้อหรือขาย หากราคาช่วงใดมีปริมาณมากกว่าระหว่างแท่งเทียนขาขึ้น (ปิด ≥ เปิด) เส้นโปรไฟล์จะถูกระบายสีเขียว หากปริมาณขาลงมีมากกว่า เส้นจะถูกระบายสีแดง
การปรับแต่งพารามิเตอร์:
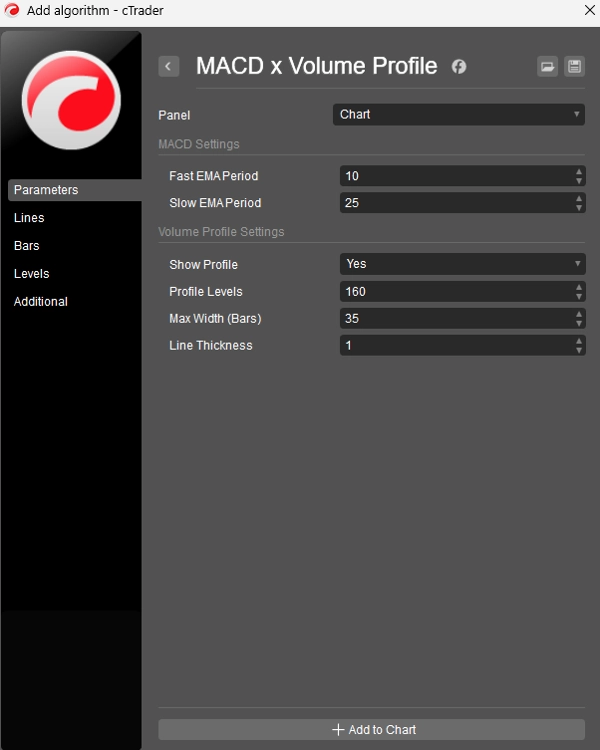
- การตั้งค่า MACD: ปรับช่วงเวลาของ EMA เร็วและช้าได้อย่างเต็มที่
- ความละเอียดของโปรไฟล์: พารามิเตอร์ระดับโปรไฟล์ช่วยให้คุณปรับความละเอียดของ volume profile (ตั้งแต่ 10 ถึง 200 ถังราคา)
- การปรับแต่งภาพ: ผู้ใช้สามารถเปิดหรือปิดการมองเห็นโปรไฟล์ ปรับขนาดความกว้างสูงสุดบนหน้าจอ และปรับความหนาของเส้นเพื่อให้แผนภูมิสะอาดและเหมาะกับความชอบทางสายตาของตน
สรุป
AI summary
The MACD x Volume Profile is a cTrader (cAlgo) overlay indicator that integrates the MACD's Fast and Slow Exponential Moving Averages (EMAs) with a dynamic Volume Profile on the main price chart. It displays a Fast EMA (default 10) and Slow EMA (default 25) to help identify trend direction and momentum through their crossings and separations. The Volume Profile dynamically calculates volume distribution based on the currently visible bars, updating automatically with chart navigation. The indicator highlights the Point of Control (POC)—the price level with the highest traded volume—using a distinct yellow line to mark key support or resistance zones. Volume bars are color-coded green or red to indicate buying or selling pressure, respectively. Users can customize MACD periods, adjust the granularity of the volume profile (10 to 200 price buckets), and modify visual settings such as profile visibility, width, and line thickness to suit their preferences. This tool combines momentum analysis with liquidity visualization to support trading decisions.
โปรไฟล์อินดิเคเตอร์
หมวดหมู่อินดิเคเตอร์
ปริมาณ
ประเภทเอาต์พุต
การแสดงเป็นภาพ
ข้อกำหนดด้านข้อมูล
ปริมาณ
สัญญาณที่รองรับ
ความแข็งแกร่งของแนวโน้ม
Reversal
รีวิวจากลูกค้า
0.0
รีวิว: 0
รีวิวจากลูกค้า
ยังไม่มีรีวิวสำหรับผลิตภัณฑ์นี้ หากเคยลองแล้ว ขอเชิญมาเป็นคนแรกที่บอกคนอื่น!
การสนทนา
คำถามที่พบบ่อย
EMA
Volume
MACD
Moving Average
ผลิตภัณฑ์ที่มีให้บริการผ่าน cTrader Store รวมถึงบอทการเทรด อินดิเคเตอร์ และปลั๊กอิน มีให้บริการโดยนักพัฒนาบุคคลที่สามและมีไว้เพื่อวัตถุประสงค์ในการเข้าถึงข้อมูลและทางเทคนิคเท่านั้น cTrader Store ไม่ใช่โบรกเกอร์และไม่ได้ให้คำแนะนำการลงทุน คำแนะนำส่วนบุคคล หรือการรับประกันผลการดำเนินงานในอนาคต
เพิ่มเติมจากผู้เขียนคนนี้





















ราคา
ตั้งแต่ 21/02/2026
17.53M
ปริมาณการเทรด
2.85K
Pips ที่ได้กำไร
1
การขาย