present
Sign up and get $50 off your first purchase
Since 16/10/2026
7
Sales

Description

Axiom Matrix


One dashboard for comparing markets and choosing which chart to study next.


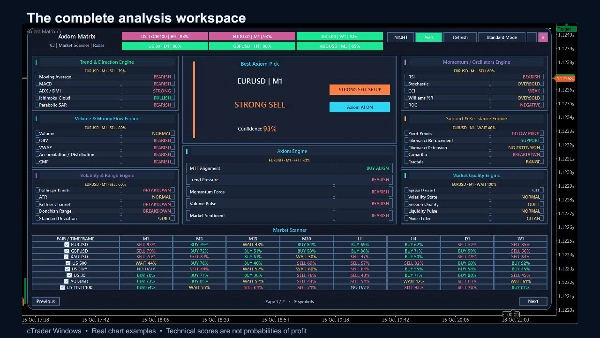
Axiom Matrix is a cTrader indicator that organises technical analysis across your watchlist. Its matrix brings symbols, timeframes and evidence together, so you can compare conditions without repeatedly opening each chart.


Seven connected analysis engines


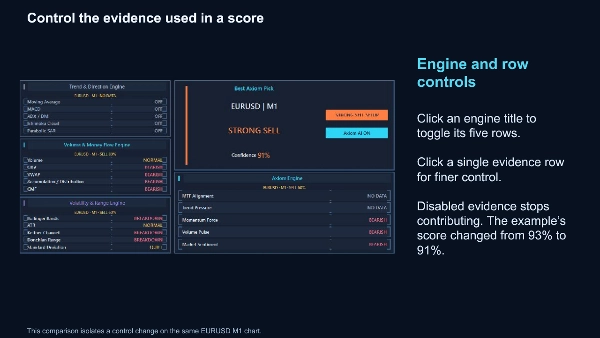
Trend & Direction, Volume, Volatility, Momentum, Support & Resistance, Market Quality and Axiom combine 35 evidence rows into a structured view. Inspect the reasoning on the current chart and enable or disable individual evidence rows or entire engines.


A practical market shortlist


Scan up to 27 broker-supported symbols across M1, M5, M15, M30, H1, H4, D1 and W1. Use a cTrader watchlist or enter exact broker symbol names. Include or exclude individual symbols and periods. Best Axiom Pick highlights the retained leading setup, while six ranked shortcuts make it easier to explore other candidates. Click a valid matrix cell or ranked pick to navigate to its chart.


Read the evidence, not just a signal


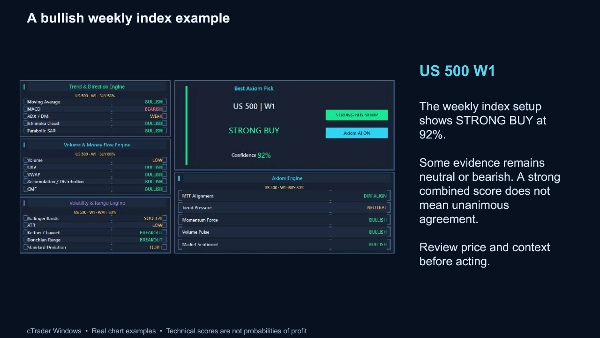
BUY, SELL and WAIT states summarise agreement between enabled technical rules. Confidence is a rule-based agreement score, not a probability of profit or a measured win rate. Axiom AI is the control for this technical analysis system; it does not use a remote prediction service. Volume calculations use the broker's tick-volume data.


An adaptable workspace


Choose Full or Standard view, light or dark styling, a chart-filling or movable panel, and configurable keyboard shortcuts. Panel preferences and evidence choices are retained. Optional current-chart arrows mark qualifying closed-bar decisions; they do not reconstruct a historical trade record.


Optional notifications


Configure desktop popups or email notifications for qualifying changes among the first three ranked setups. Email delivery requires working cTrader email settings and valid sender and recipient details. Initial historical setups are suppressed to avoid an alert burst when the indicator starts.


Getting started


Install the indicator in cTrader Windows, attach it to a chart, select your watchlist and allow history to load. Review a shortlisted chart and its evidence before making an independent trading decision. Missing, stale or insufficient data is shown explicitly. Available history and results depend on your broker and enabled settings.


Axiom Matrix supports manual analysis. It does not open, manage or close trades. Trading involves risk; technical signals can fail. Test your configuration on a demo account first.


Summary

AI summary
Axiom Matrix is a cTrader indicator designed to consolidate technical analysis across multiple markets and timeframes into a single interactive dashboard. It enables comparison of up to 27 broker-supported symbols across eight timeframes (M1, M5, M15, M30, H1, H4, D1, W1) using a watchlist or manual symbol entry. The indicator integrates seven analysis enginesโ€”Trend & Direction, Volume, Volatility, Momentum, Support & Resistance, Market Quality, and Axiomโ€”providing 35 evidence rows that collectively inform BUY, SELL, or WAIT states based on rule-based agreement scores. Users can enable or disable individual evidence rows or entire engines to tailor analysis. The dashboard highlights the leading setup ("Best Axiom Pick") and offers ranked shortcuts for quick navigation to charts. Axiom Matrix supports configurable views, styling options, keyboard shortcuts, and panel layouts, with preferences saved between sessions. Optional desktop and email notifications alert users to qualifying changes among top-ranked setups. The indicator uses broker tick-volume data and operates entirely within cTrader without remote prediction services. It supports manual market analysis and does not execute trades. Users install it on cTrader Windows, select a watchlist, and review evidence before making independent trading decisions.
Indicator profile
Indicator category
Support & resistance
Output type
Visualisation
Signals
Data requirements
Bars only
Volume
Supported signals
Trend strength

Discussion

Customer reviews

4.6
Reviews: 3
5
67 %
4
33 %
3
0 %
2
0 %
1
0 %
Customer reviews
October 26, 2026
Best Pick is a ranking inside the tool, which is handy for navigating 27 symbols, 8 timeframes and 7 engines. The evidence rows are still worth inspecting. The label doesn't turn the next trade into a verified probability.
October 22, 2026
Being able to inspect or disable evidence rows is the real win in a matrix this large. Seven engines can cover 27 symbols and 8 timeframes without hiding all the ingredients. The breadth has a useful interface behind it rather than just more numbers to stare at.
October 21, 2026
Inspecting and switching evidence rows makes the 27 symbol, 8 timeframe, 7 engine matrix genuinely usable, with Best Pick remaining a traceable ranking rather than an unexplained confidence badge.

FAQ

Volume
Support & Resistance
Products available through cTrader Store, including trading bots, indicators and plugins, are provided by third-party developers and made available for informational and technical access purposes only. cTrader Store is not a broker and does not provide investment advice, personal recommendations or any guarantee of future performance.

Price

Since 16/10/2026
7
Sales