"Volume Weighted Average Price" logo
Volume Weighted Average Price
0.0
03/09/2025
2
Desktop

VWAP (Volume Weighted Average Price) is a trading benchmark that calculates the average price of an asset adjusted by trading volume over a specified period. It is widely used by day traders, institutions, and algorithmic trading systems to assess fair value and optimize trade execution.

Key Formula:

VWAP=∑(Price×Volume)​/∑Volume

  • Price = Typical price (High + Low + Close) / 3 or just Close price.
  • Volume = Trading volume for each period.

2. Why Use VWAP?

Purpose:

1)Fair Value Reference

Price > VWAP = Bullish bias; Price < VWAP = Bearish bias.

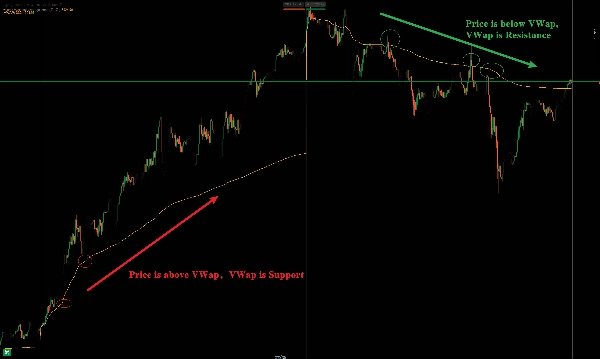
2)Dynamic Support/Resistance

Acts as a key level for intraday breakouts/reversals.

3) Trend Confirmation

Price holding above VWAP = Uptrend; Below = Downtrend.


Volume Weighted Average Price (VWAP) 指标详解及用法

1. 基本概念

VWAP(成交量加权平均价) 是一种技术分析工具,用于衡量资产在特定时间段内的平均交易价格,并根据成交量进行加权计算。它帮助交易者判断当前价格相对于市场的“公平价值”,常用于日内交易、算法交易和机构执行订单。

核心公式

VWAP=∑(Price×Volume)​/∑Volume

每条K线的价格 × 成交量累加,再除以总成交量,得到动态加权均价。

2. VWAP 的主要用途

用途:

1)判断市场公允价格

价格高于VWAP = 偏强;低于VWAP = 偏弱。

2)支撑/阻力参考

VWAP常作为短线交易的动态支撑/阻力位。

3)日内趋势确认

价格持续在VWAP上方 = 多头主导;下方 = 空头主导。

More from this author
Indicator
breakout
Pivot Points Daily Session
Pivot Point with base zone daily Asia-London-New york Session.
RiskRewardTools
Risk Reward management tools (风险回报管理工具)
IRiskRewardTools
Risk Reward Management Tools(风险回报管理工具)
Indicator
breakout
rsi
macd
ZigZagColor
The ZigZag indicator is a technical analysis tool primarily used to identify key price reversal points.
SuperEmaColorRSI
This is a super indicator that integrates the RSI indicator with a dual moving average system.
You may also like
Renko Wicks
Renko Wicks
DayOfWeek - FXMaster
Day of Week Indicator for cTrader
EMA UP&DOWN 2025
SectorIndex Dual Moving Average Indicator: Your Market Compass 🧭
SmartArrows AI V2
High-Performance Renko Chart Indicator with Advanced AI Filtering.
Pivot Point Daily Indicator
Pivot Points Standard — All-in-One Multi-Timeframe Pivot Indicator for cTrader
Indicator
forex
indices
gbpusd
+10
Tsunami Volume Surge - RVOL
🌊 Tsunami Volume Surge (RVOL) — Relative Volume Indicator for cTrader 🌊
Ten Thousand Functions Bands Cloud(First Edition)
A metric that can set 1 to 3 groups of Bollinger Bands
Precio Promedio Ponderado por Volumen
VWAP (Volume Weighted Average Price, Precio Promedio Ponderado por Volumen)
Indicator
breakout
btcusd
supertrend
+5
Zones Supply Demand
📊Zones Supply & Demand: Identifies key price levels with high volume concentration, marking Supply/Demand Zones & Marke
Indicator
forex
eurusd
usdjpy
+2
4 RCS Relative Strength w Alerts_NSC
Forex Strength Meter for cTrader: 4 custom currencies, cross alerts, visual arrows. Trade smarter!
Indicator
forex
indices
rsi
+3
Advanced RSI Indicator
Advanced RSI Indicator with multi-MA smoothing, Bollinger Bands, divergence detection, and fill zones for cTrader.
Indicator
breakout
bollinger
supertrend
+3
Fibonacci Linear Regression Multi-timeframe
Combining Fibonacci levels and regression to analyze multidimensional market trends across multiple timeframes¡
VWAP Tank Btn
Custom Vwap Indicator
ZigZagSmartAlert_demo
ZigZag Smart Alert DEMO for cTrader DEMO VERSION 24 hours free trial! This is a DEMO version of the ZigZag Smart Aler
Indicator
bollinger
JMA
Jurik Moving Average (Jurik's Moving Average) triple adaptive filter with unique Jurik smoothing and dynamic factor.
LT Flexible Volume Profile
Flexible Volume Profile, designed with performance in mind.
Indicator
breakout
bollinger
signal
[Hamster-Coder] Bollinger Bands
Bolliger Bands + Hamster-Coder™ Timeframe Decoupling
Indicator
breakout
forex
commodities
+3
MAGIC BLOCK STRATEGY
Block Liquidity,indicator.Block Order, Liquids Stops, Signal Sentiment,signal correction