Brokers & props
For business
00
Days
:
00
Hours
:
00
Minutes
:
00
Seconds
HTFOverlayPlus
"HTFOverlayPlus" logo
Since 10/02/2025
Free installs
839
"HTFOverlayPlus" uploaded image

Este indicador sobrepõe candles de um time frame superior sobre o gráfico do time frame atual. Ele permite visualizar até 50 candles de um time frame maior e ajusta a cor das velas de acordo com a direção do preço (alta ou baixa). O indicador oferece a possibilidade de personalizar a espessura das bordas do corpo das velas e as cores para velas de alta e baixa. Ele é útil para traders que desejam visualizar a ação do preço em time frames superiores enquanto operam em time frames menores, permitindo uma análise mais precisa das tendências. (Obs: funciona com corpo invisível apenas no time frame e o resto apenas pinta.)


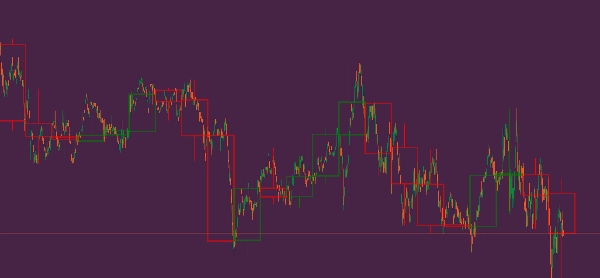
This indicator overlays candles from a higher time frame onto the current chart time frame. It allows you to display up to 50 candles from a larger time frame and adjusts the candle color based on price direction (bullish or bearish). The indicator provides the option to customize the body thickness and the colors for bullish and bearish candles. It is useful for traders who want to visualize higher time frame price action while trading on smaller time frames, enabling more accurate trend analysis. (Note: only works with invisible body in the time frame and the rest just paints.)


Este indicador superpone velas de un marco temporal superior en el gráfico del marco temporal actual. Permite mostrar hasta 50 velas de un marco temporal mayor y ajusta el color de las velas según la dirección del precio (alcista o bajista). El indicador ofrece la posibilidad de personalizar el grosor de los bordes del cuerpo de las velas y los colores para las velas alcistas y bajistas. Es útil para los traders que desean visualizar la acción del precio en marcos temporales superiores mientras operan en marcos temporales más pequeños, lo que permite un análisis más preciso de las tendencias. (Nota: solo funciona con cuerpo invisible en el marco temporal y el resto solo pinta.)

0.0
Reviews: 0
Customer reviews
No reviews for this product yet. Already tried it? Be the first to tell others!
More from this author
VWAP Tabajara
VWAP Tabajara
Larry Williams 9.1
Larry Williams 9.1
HeatMap Candle
HeatMap Candle
Tabajara corrigido[fix]
corrigido todos os bugs e cores invertidas tabajara antigo deleetado
You may also like
Indicator
Grid
NAS100
RSI
+17
Sessions with OR
Session boxes with UTC offset, OR logic, adjustable opacity, and multi-day lookback.
Indicator
NAS100
NZDUSD
Martingale
+26
z-score colored
The Rolling Z-Score Trend
[Hamster-Coder] Pivot Points (Demo)
[Hamster-Coder] Pivot Points (Demo)
Order Block Finder
Order Block Detector is built to spot and display Order Blocks on chart, often triggering strong price reactions.
IR Spread
show spread on chart
Parabolic SAR Alert
Parabolic SAR Alert - Trend reversal alerts with smart signals & custom alerts.
VegaXLR - cTrader Multi-Timeframe Pivot Pro
Customizable multi-timeframe pivot point indicator for cTrader with alerts, Fibonacci, CPR, and more!
Cumulative Delta Candles + VolumeProfile
Cumulative delta candles + volume profile
Indicator
Scalping
ACTO-v1
ACTO: Oscillator tracking average candle duration to anticipate volatility shifts in trading.
Indicator
Breakout
Stocks
Commodities
+1
Advanced Donchian Zones
MTF Donchian: Identify trend breakouts & key zones with precision. Perfect for swing & day traders seeking accuracy!
Indicator
Indices
Stocks
Commodities
+2
Volume Activity Profiler
Volume profiler applying Wyckoff effort vs result and spread analysis with visual bar graphs.
Trend Direction Force Index - TDFI (Alerts)
Spot Strong Trends Early & Filter Market Noise
Indicatore livelli numeri tondi_fabio23.traders
Indicatore dei livelli numeri tondi sul grafico , regolabile.Indicator of levels round numbers on the graph, adjustable
E7 Correlation Dashboard
E7 Correlation Dashboard.
Indicator
NAS100
NZDUSD
XAUUSD
+13
Side Volume Profile
Right-anchored cTrader Volume Profile with VAH/VAL/POC, LVZ, top volume+EMA, themes, and fast, readable visuals.
Indicator
Grid
NAS100
NZDUSD
+20
QX RiskShield
Risk-first position sizing panel for indices and FX majors. Clean. Non-repainting. Built for real trading.
Indicator
NAS100
NZDUSD
XAUUSD
+11
Samurai Breakout Lite
⚔️Limited version. Draws clean session box (Tokyo / London / New York / Overlap) and optional breakout plan (EP/TP/SL)⚔️
Indicator
Indices
RSI
StochasticRSI
Stochastic RSI (StochRSI) is a technical indicator used to measure the strength and weakness of the RSI.