
Descrizione
📊 TrendHeikinMultiMA – Algoritmo Avanzato di Trend
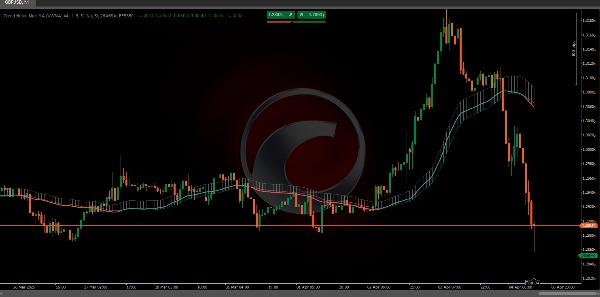
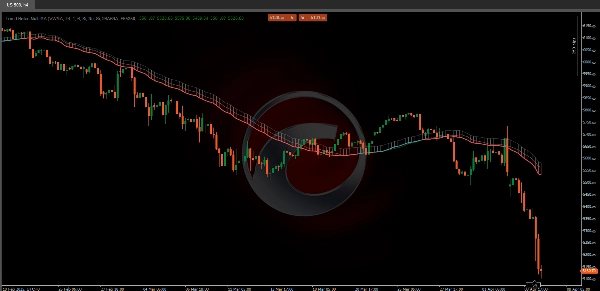
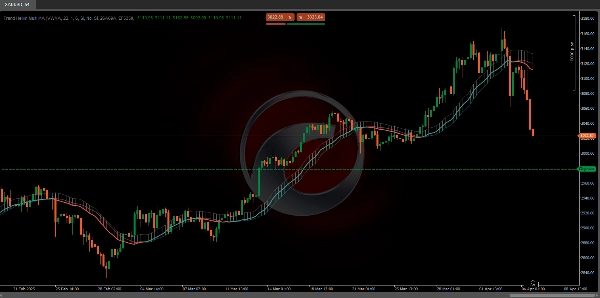
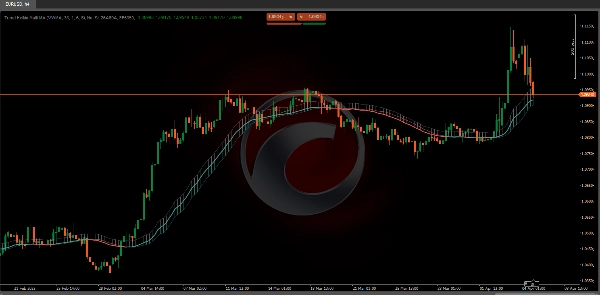
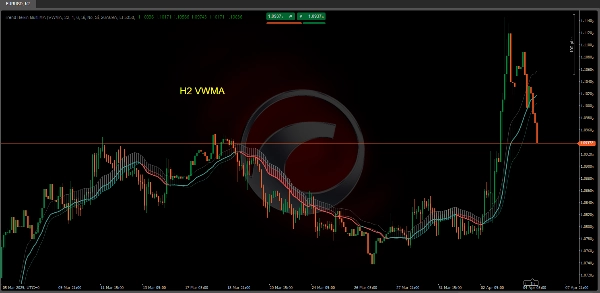
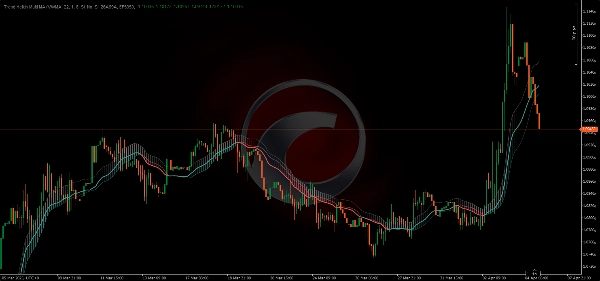
L'algoritmo TrendHeikinMultiMA è progettato per calcolare valori di trend dai dati di prezzo, utilizzando la formula Heikin-Ashi per smussare questi valori e applicando diversi tipi di medie mobili (ALMA, HMA, SMA, SWMA, VWMA, WMA, ZLEMA o EMA).
Sebbene i valori Heikin-Ashi siano utilizzati internamente, il grafico non mostra le tradizionali candele Heikin-Ashi. Invece, disegna linee di trend basate sui valori smussati, rendendo più facile interpretare la direzione del mercato senza la complessità visiva dei grafici a candela.
🔄 1. Il Ruolo della Smussatura
Poiché i valori di trend derivano dalla smussatura Heikin-Ashi combinata con una media mobile, il cambio di colore in TrendHeikinMultiMA non avviene immediatamente quando il prezzo attraversa la linea di trend:
- 🔹 Il prezzo può temporaneamente muoversi sopra o sotto la linea di trend senza causare un cambio di colore.
- 🔹 Questo accade perché l'indicatore attende una differenza significativa e sostenuta tra i valori smussati di apertura e chiusura per confermare un reale inversione di trend.
✅ Vantaggio nell'Interpretazione
Questo ritardo intenzionale nel cambio di colore aiuta a evitare falsi segnali. In un tradizionale grafico a candele, il prezzo potrebbe attraversare brevemente la linea di trend e generare segnali prematuri.
- 🟥 Ad esempio, anche se il prezzo attuale è sopra una linea di trend ribassista, l'indicatore rimarrà rosso (ribassista) finché i valori smussati non confermeranno che la chiusura è costantemente superiore all'apertura.
- 🟩 Analogamente, per passare a verde (rialzista), la media mobile basata su Heikin-Ashi deve confermare che la chiusura supera costantemente l'apertura.
📈 2. Applicazione delle Medie Mobili ai Valori Heikin-Ashi
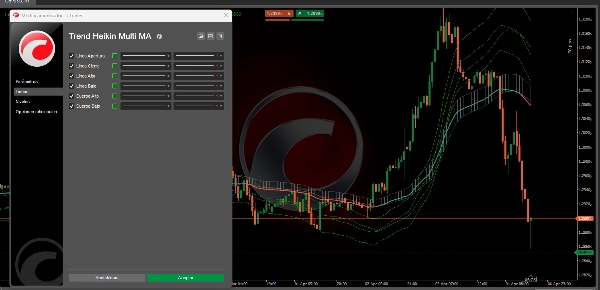
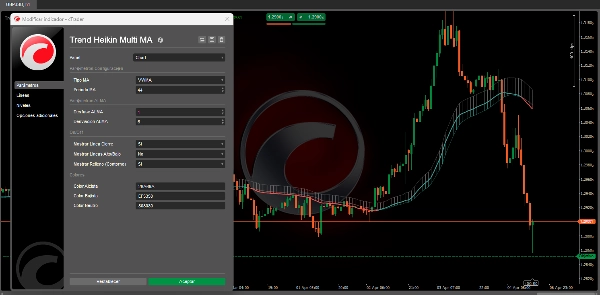
- 🔄 Selezione della Media Mobile:
-
- L'utente può scegliere tra diversi tipi di medie mobili (ALMA, HMA, SMA, SWMA, VWMA, WMA, ZLEMA e EMA).
- Ogni tipo di MA applica un metodo matematico specifico per pesare e smussare i valori storici di apertura, chiusura, massimo e minimo derivati da Heikin-Ashi.
🏆 3. Vantaggi dell'Uso di TrendHeikinMultiMA rispetto alle Candele Tradizionali
- 📉 Riduzione del Rumore:
-
- Le candele tradizionali spesso mostrano alta volatilità e dati sparsi, rendendo più difficile identificare il trend generale.
- TrendHeikinMultiMA smussa questi dati, filtrando le fluttuazioni minori ed eliminando oscillazioni brusche, permettendo ai trader di concentrarsi sulla direzione principale del mercato.
✅ Conclusione
In sintesi, TrendHeikinMultiMA conferma un cambiamento di trend (rialzista o ribassista) solo quando i valori smussati di apertura e chiusura—calcolati da Heikin-Ashi e processati attraverso la media mobile selezionata—mostrano costantemente che il comportamento del mercato ha invertito la sua direzione.
Questo garantisce che i segnali siano più affidabili e meno influenzati dal rumore presente nei grafici a candele tradizionali. 🚀📊
🔥 Indicatori Pinescritlabs Ctrader Store 🔥
Dynamic Market Structure
Analisi dei Punti di Inversione
Fibonacci Linear
Regression Multi-timeframe
Multi-Level Candle Bias
Tracker
Auto Support and
Resistance Trend Lines
All Support and
Resistance Levels
Riepilogo
The indicator incorporates a smoothing mechanism that delays color changes to confirm trend reversals only after a significant and sustained difference between smoothed open and close values is detected. This approach reduces false signals caused by brief price fluctuations crossing trend lines.
Users can select from multiple moving average types, each applying distinct mathematical weighting methods to the Heikin-Ashi-derived open, close, high, and low values, enhancing customization and adaptability to different trading styles.
Compared to traditional candlestick charts, Trend Heikin Multi MA filters out minor price fluctuations and abrupt swings, allowing traders to focus on primary market trends with more reliable signals. It confirms bullish or bearish trend changes only when smoothed values consistently indicate a market direction reversal, improving signal accuracy and reducing noise.
Recensioni dei clienti
5 | 33 % | |
4 | 67 % | |
3 | 0 % | |
2 | 0 % | |
1 | 0 % |


![Logo di "High-Low Divergence [Iridio Capital]"](https://cdn.ctrader.com/image/webp/443c4661-7abb-40f1-842f-4b6ec560649b_40914)
