
Descrizione
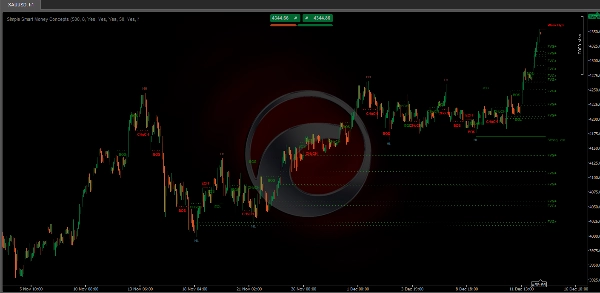
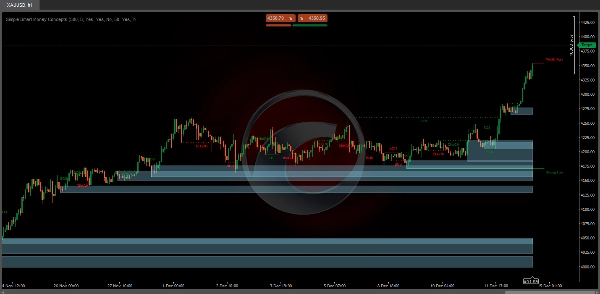
Questo indicatore Simple Smart Money Concepts mostra in tempo reale la struttura del mercato (BOS interno & swing / CHoCH), blocchi d'ordine, zone di premio & sconto, massimi & minimi uguali, e molto altro... permettendo ai trader di annotare automaticamente i loro grafici con metodologie di price action ampiamente utilizzate.
"Smart Money Concepts" (SMC) è un termine usato tra i trader di price action che cercano di navigare più accuratamente la liquidità & trovare punti di interesse più ottimali nel mercato. Cercare di determinare dove i partecipanti istituzionali al mercato hanno posizionato gli ordini può essere un approccio molto ragionevole per trovare ingressi & uscite più pratici basati sulla price action.
Caratteristiche principali
- Struttura di mercato interna e swing in tempo reale:
-
- Strutture interne: Questi elementi si riferiscono alle formazioni e ai modelli di prezzo che si verificano in un ambito più ristretto o in una specifica sessione di trading. La suite può rilevare dettagli intricati come livelli minori di supporto/resistenza o inversioni di tendenza a breve termine.
- Strutture esterne: Queste coinvolgono modelli e tendenze di mercato più ampi e significativi che si estendono su più sessioni o intervalli temporali. Questa capacità aiuta i trader a comprendere le direzioni generali del mercato.
- Aree HH/LH/LL/LH:
-
- Identificare Higher Highs (HH), Lower Highs (LH), Lower Lows (LL) e Lower Highs (LH) aiuta a comprendere la tendenza e la struttura del mercato, supportando l'analisi predittiva.
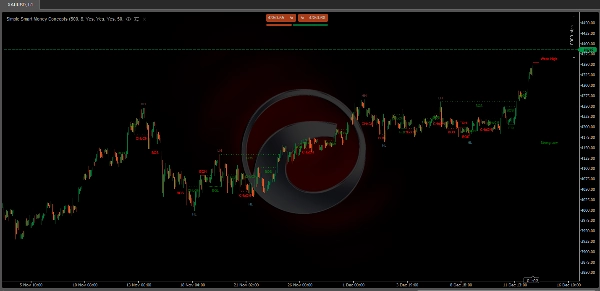
- Break of Structure (BOS):
-
- Questa funzione identifica i punti in cui il prezzo rompe una struttura significativa, indicando potenzialmente una nuova tendenza o un'inversione di tendenza.
- Change of Character (CHoCH):
-
- Rileva sottili cambiamenti nel comportamento del mercato, che potrebbero suggerire le prime fasi di un cambiamento di tendenza prima che diventino evidenti al mercato più ampio.
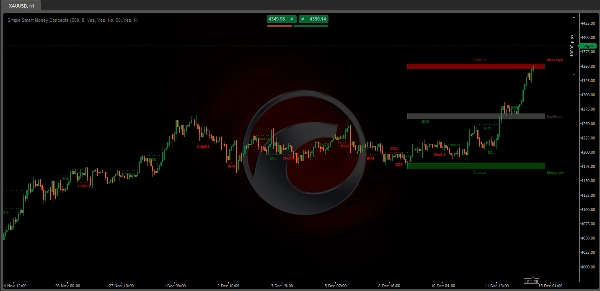
- Blocchi d'ordine:
-
- Questi sono essenzialmente livelli o zone di prezzo dove in precedenza si sono verificate attività di trading significative, probabilmente indicando le posizioni dello smart money.
- Massimi e minimi uguali
-
- Mostra etichette EQH/EQL sul grafico per rilevare massimi & minimi uguali.
- Fair Value Gaps:
-
- Fair Value Gaps: Una formazione di tre candele dove le ombre delle candele adiacenti a quella centrale non si sovrappongono, evidenziando un'area di gap.
- Massimi & minimi precedenti:
-
- Permette all'utente di visualizzare massimi & minimi precedenti dai timeframe giornalieri, settimanali & mensili come livelli significativi
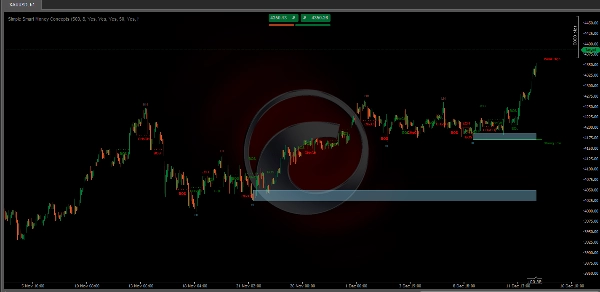
- Zone di premio & sconto come intervallo:
-
- Permette all'utente di visualizzare zone di Premio, Sconto ed Equilibrio sul grafico
Caratteristiche personalizzabili
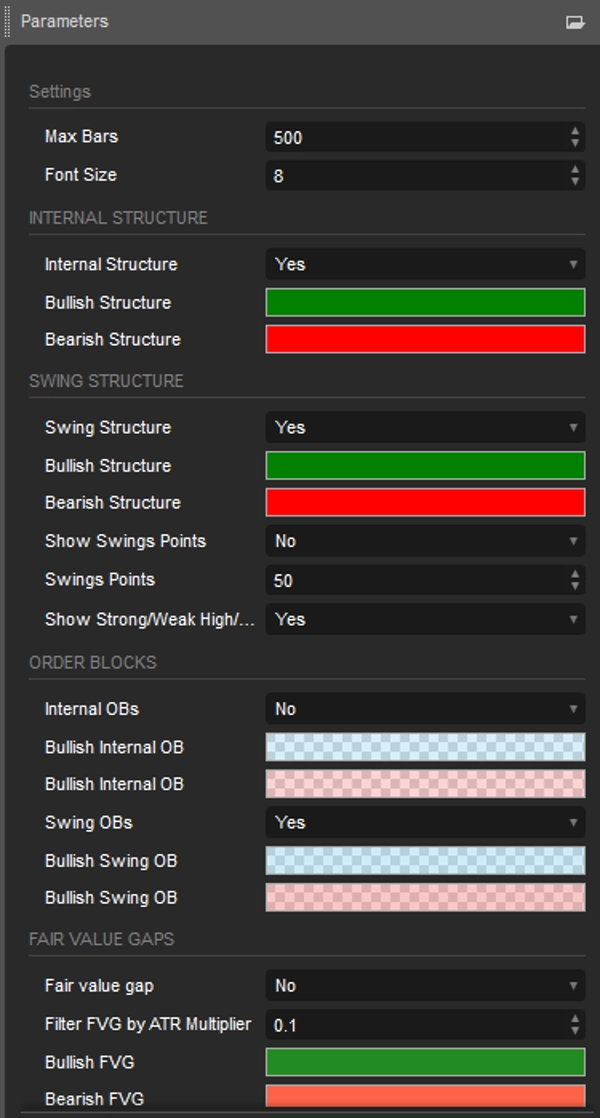
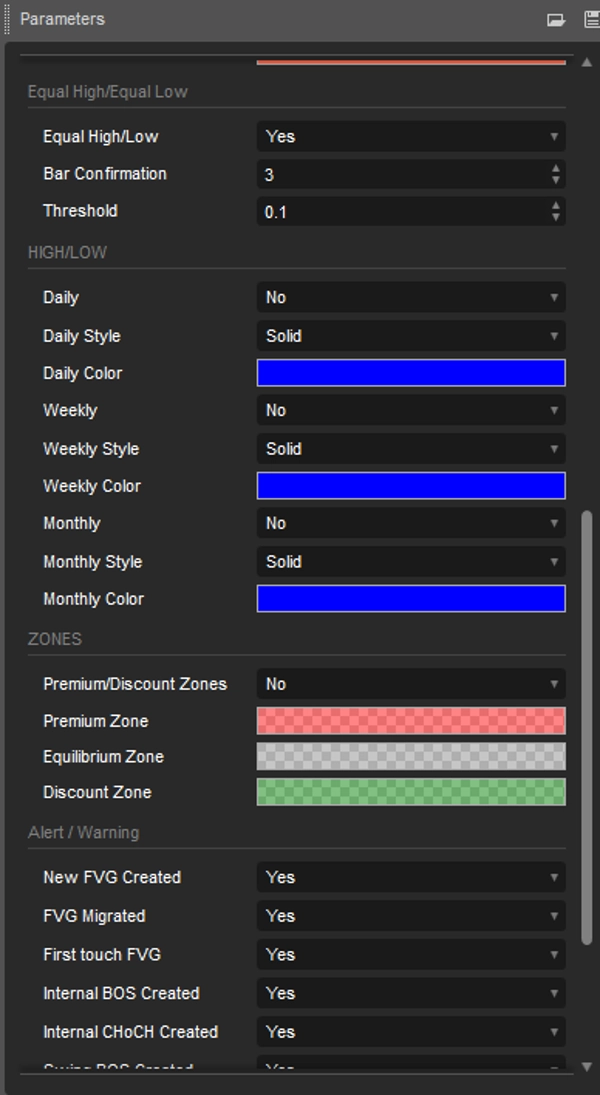
- Gli utenti possono regolare impostazioni come la lunghezza dei dati, i colori e gli stili di visualizzazione per adattarsi alle loro preferenze di trading.
Vantaggi per i trader
- Risparmia tempo sull'analisi manuale, migliorando l'efficienza del trading.
- Aiuta a prendere decisioni rapide e informate durante condizioni di mercato volatili.
- Facile da usare sia per principianti che per trader esperti.
Conclusione
Il Simple Smart Money Concepts Indicator non è solo uno strumento ma una soluzione completa per i trader che cercano di implementare efficacemente le strategie ICT. È una scelta robusta per migliorare l'analisi di mercato e eseguire operazioni precise.
Riepilogo
Additional features include the identification of equal highs and lows, fair value gaps (three-candle formations indicating price gaps), and previous highs and lows across daily, weekly, and monthly timeframes. It also displays premium, discount, and equilibrium zones to help traders assess value areas.
Users can customize settings such as data length, colors, and display styles to fit their trading preferences. The indicator supports analysis across multiple markets including Forex, cryptocurrencies (e.g., BTCUSD), stocks, and commodities (e.g., XAUUSD).
Designed to streamline chart analysis, the Simple Smart Money Concepts indicator aids traders in making informed decisions by visually representing widely used price action methodologies and institutional order flow concepts.
Recensioni dei clienti
5 | 33 % | |
4 | 67 % | |
3 | 0 % | |
2 | 0 % | |
1 | 0 % |


![Logo di "[Hamster-Coder] Pivot Points MTF"](https://cdn.ctrader.com/image/webp/4c143e5a-309c-40e3-a578-f04d1e133ffa_31159)

![Logo di "Gaussian Channel [Iridio Capital]"](https://cdn.ctrader.com/image/webp/7c039209-5573-4a54-a072-f9528b503103_41960)
![Logo di "[Stellar Strategies] MARSI Signal Plotter"](https://cdn.ctrader.com/image/webp/7b2b8da6-8f8e-4646-8d4a-4710c516c01e_25567)


