
Dem
อินดิเคเตอร์
2 การซื้อ
เวอร์ชัน 2.0, Apr 2026
Windows, Mac
4.2
รีวิว: 4

คำอธิบาย
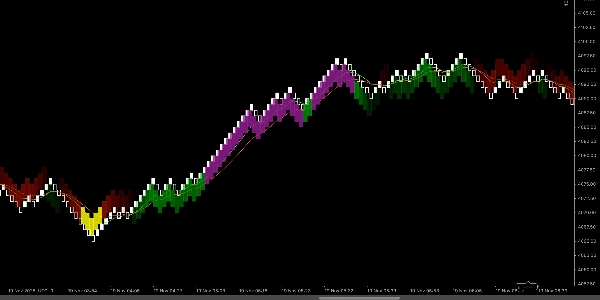
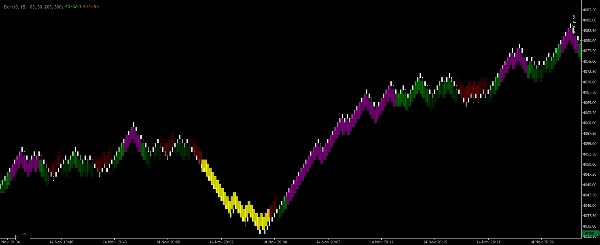
Renko EMA-Scalper Zones เป็นตัวบ่งชี้สเกลเปอร์ที่มีน้ำหนักเบาและมองเห็นได้ชัดเจน สร้างขึ้นเฉพาะสำหรับ กราฟ Renko 100-pip บนแพลตฟอร์ม cTrader ใช้ค่าเฉลี่ยเคลื่อนที่แบบเอ็กซ์โพเนนเชียลสองค่า (EMA) เพื่อระบุทิศทางแนวโน้มระยะสั้นและเน้นโซนที่สะอาดและสามารถเทรดได้ ตัวบ่งชี้จะวาดสี่เหลี่ยมที่เติมสีบนกราฟในสี่สีเพื่อให้สเกลเปอร์สามารถอ่านความเอนเอียงของตลาดได้ทันทีและหาจุดเข้าที่มีโอกาสสูงโดยไม่ต้องคำนวณตัวเลขด้วยตนเอง
ความหมายของแต่ละสี
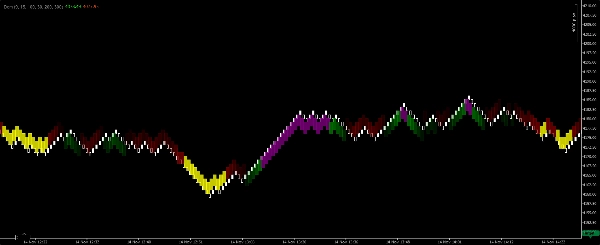
- สี่เหลี่ยมสีเขียว — ยืนยันแนวโน้มขาขึ้น EMA เร็วอยู่เหนือ EMA ช้าและ EMA ทั้งสองมีทิศทางขึ้น ใช้สำหรับการซื้อระยะสั้นตามแนวโน้ม
- สี่เหลี่ยมสีม่วง — โซนเข้าซื้อภายในบริบทขาขึ้น แสดงถึงการดึงกลับหรือการรวมตัวระยะสั้นภายในแนวโน้มขาขึ้นที่ยังคงใช้งานอยู่ ซึ่งอาจเป็นโอกาสสำหรับการสเกลป์
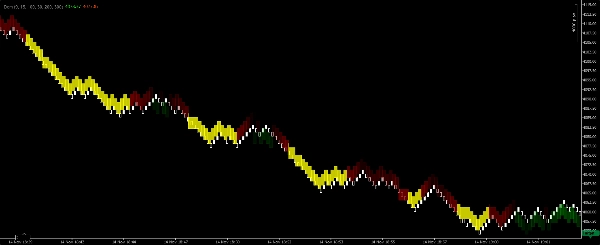
- สี่เหลี่ยมสีแดง — ยืนยันแนวโน้มขาลง EMA เร็วอยู่ต่ำกว่า EMA ช้าและ EMA ทั้งสองมีทิศทางลง ใช้สำหรับการขายระยะสั้นตามแนวโน้ม
- สี่เหลี่ยมสีเหลือง — โซนเข้าขายภายในบริบทขาลง แสดงถึงการดึงกลับหรือการรวมตัวระยะสั้นภายในแนวโน้มขาลงที่ยังคงใช้งานอยู่ ซึ่งอาจเป็นโอกาสสำหรับการสเกลป์
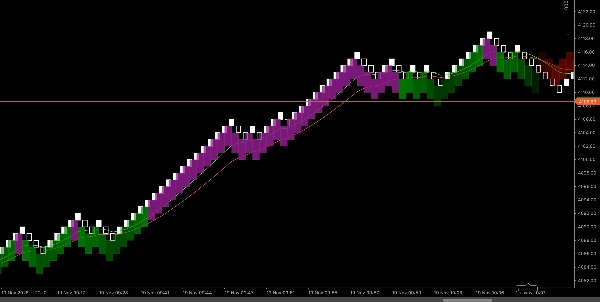
วิธีการทำงาน (สรุปตรรกะ)
- ตัวบ่งชี้คำนวณ EMA สองค่า (เร็วและช้า) บนกราฟ Renko 100-pip และประเมินการจัดเรียงสัมพัทธ์และความชันของพวกมันเพื่อกำหนดทิศทางแนวโน้ม
- เมื่อ EMA แสดงการจัดเรียงและโมเมนตัมขาขึ้นที่ชัดเจน ตัวบ่งชี้จะวาดสี่เหลี่ยมสี เขียว ที่ครอบคลุมพื้นที่แนวโน้ม หากมีการรวมตัวหรือดึงกลับระยะสั้นภายในโซนขาขึ้นนั้น ตัวบ่งชี้จะวาดสี่เหลี่ยมสี ม่วง เพื่อแสดงโอกาสเข้าซื้อ
- ตรรกะเดียวกันนี้ใช้ในทางกลับกันสำหรับสภาวะขาลง โดยสร้างสี่เหลี่ยมสี แดง (แนวโน้ม) และ เหลือง (จุดเข้า)
- สี่เหลี่ยมถูกวาดเป็นโซน (ไม่ใช่แท่งเดียว) เพื่อให้สเกลเปอร์สามารถประเมินด้วยสายตาว่าควรจับจังหวะเข้าหรือออกอย่างรวดเร็วที่ไหน
การตั้งค่าที่แนะนำ (ค่าเริ่มต้นสำหรับสเกลเปอร์)
- ประเภทกราฟ: Renko
- ขนาดอิฐ Renko: 100 pips (ตัวบ่งชี้ออกแบบมาสำหรับขนาดอิฐนี้)
- ความไว / การตรวจจับ — พารามิเตอร์ที่ปรับได้ควบคุมความเข้มงวดที่ตัวบ่งชี้ต้องการในการจัดเรียง EMA ก่อนวาดสี่เหลี่ยมแนวโน้ม (ค่าต่ำ = สัญญาณมากขึ้น; ค่าสูง = สัญญาณน้อยลงแต่แข็งแกร่งขึ้น)
- ความทึบของสี่เหลี่ยม — ปรับเพื่อความชัดเจนในการมองเห็นเหนือแท่งราคา
- ตัวกรองช่วงเวลา — แนะนำให้จำกัดเฉพาะช่วงเวลาที่มีสภาพคล่องสูงสำหรับการสเกลป์
- ความกว้างโซนสูงสุด (แท่ง) — ขีดจำกัดทางเลือกเพื่อหลีกเลี่ยงโซนที่ยืดออกมากเกินไป
คำแนะนำการใช้งาน & กฎสำหรับสเกลเปอร์
- ถือว่า สีเขียว/สีแดง เป็น การยืนยันแนวโน้ม ชอบเทรดตามทิศทางของโซนแนวโน้มที่มีสีและหลีกเลี่ยงการสเกลป์สวนแนวโน้มอย่างรุนแรงเมื่อมีสี่เหลี่ยมแนวโน้มเด่น
- ใช้ สีม่วง/สีเหลือง เป็น หน้าต่างเข้าซื้อสเกลป์ ภายในแนวโน้มที่ได้รับการยืนยัน — มองหาสัญญาณทริกเกอร์โครงสร้างจุลภาคอย่างรวดเร็ว (เช่น แท่งโมเมนตัม, การเบรกเอาท์ของการรวมตัวเล็กๆ) ก่อนเข้าตลาด
- เป้าหมายควรแคบและสมจริงสำหรับการสเกลป์ (เป็นจำนวนเล็กน้อยของจุดหยุดของคุณ) ใช้เป้าหมายจุดคงที่หรือการยืนยันแท่งขั้นต่ำขึ้นอยู่กับโปรไฟล์ความเสี่ยงของคุณ
- วางจุดหยุดเกินกว่าจุดต่ำ/สูงของโครงสร้างจุลภาคล่าสุดหรืออยู่นอกโซนเข้าตลาด; การสเกลป์ต้องการการควบคุมวินัยและขาดทุนเล็กน้อย
- รวมกับการยืนยันปริมาณ/การเคลื่อนไหวของราคา (ถ้ามี) และเทรดเฉพาะในช่วงเวลาที่ตลาดมีความเคลื่อนไหว
- ทดสอบย้อนหลังด้วยสายตาบนอุปกรณ์ของคุณ — Renko 100-pip เหมาะกับคู่และอุปกรณ์ที่มีความผันผวนสูงซึ่งอิฐ 100-pip สร้างโครงสร้างราคาที่มีประโยชน์สำหรับการสเกลป์
สรุป
โปรไฟล์อินดิเคเตอร์
รีวิวจากลูกค้า
4.2
รีวิว: 4
5 | 50 % | |
4 | 25 % | |
3 | 25 % | |
2 | 0 % | |
1 | 0 % |
รีวิวจากลูกค้า
November 25, 2025
A decent setup here should survive 50 quick trades without looking messy. A few sessions of data make the result easier to trust. The useful comparison is hit rate versus average R.
November 18, 2025
The product feels more useful when the plan is already written down. A 13 setup run on daily close keeps the review grounded.
November 18, 2025
This feels useful when you already has a plan. The main value is short term execution, not chasing every signal that appears. Early sizing should stay modest until the journal looks stable.
November 18, 2025
Useful tool, but not for lazy entries. It supports short term execution and feels more useful if the trader stays selective.
การสนทนา
คำถามที่พบบ่อย
BTCUSD
Forex
Signal
Scalping
Commodities
Crypto
XAUUSD
ผลิตภัณฑ์ที่มีให้บริการผ่าน cTrader Store รวมถึงบอทการเทรด อินดิเคเตอร์ และปลั๊กอิน มีให้บริการโดยนักพัฒนาบุคคลที่สามและมีไว้เพื่อวัตถุประสงค์ในการเข้าถึงข้อมูลและทางเทคนิคเท่านั้น cTrader Store ไม่ใช่โบรกเกอร์และไม่ได้ให้คำแนะนำการลงทุน คำแนะนำส่วนบุคคล หรือการรับประกันผลการดำเนินงานในอนาคต
เพิ่มเติมจากผู้เขียนคนนี้


!["[Hamster-Coder] Bollinger Bands" โลโก้](https://cdn.ctrader.com/image/webp/21d8e5d6-fb11-4bac-b9ee-cd05c2b76804_30327)


ราคา
ตั้งแต่ 14/03/2025
23
การขาย