
Descrizione
💡 Canali di Regressione Lineare e Punti ZigZag 💡
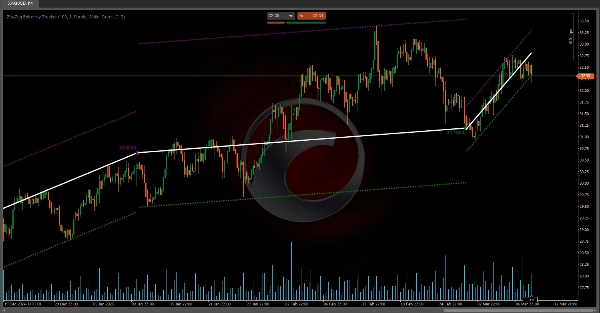
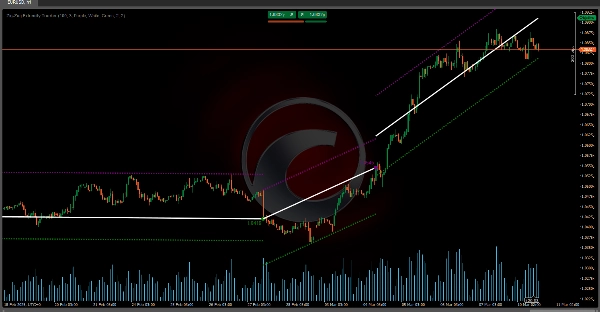
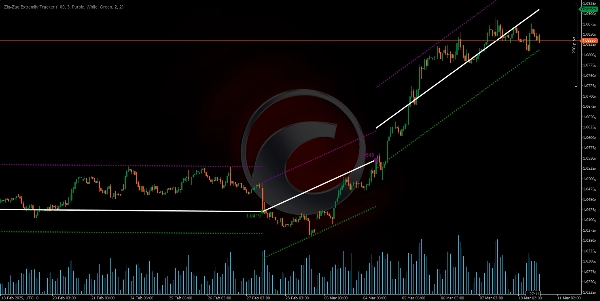
• I canali di regressione lineare vengono ricalcolati e resettati ogni volta che il prezzo si sposta oltre i confini previsti (bande), garantendo che la misurazione rimanga aggiornata con la reale tendenza del mercato.
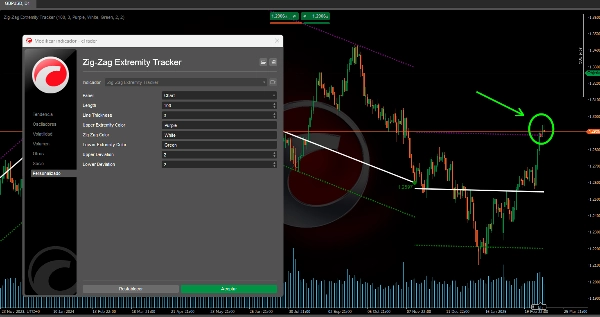
• I punti segnati (cerchi) rappresentano estremi (massimi e minimi) che servono come base per tracciare lo ZigZag e determinare da dove vengono calcolati i canali.
• Questo approccio dinamico consente una migliore visualizzazione dei potenziali cambiamenti di tendenza, così come delle aree di sovraestensione o ipervenduto dove il prezzo potrebbe tornare verso la media.
❓ Come si collegano i canali allo ZigZag e ai punti estremi? ❓
• Ogni volta che viene rilevato un nuovo estremo (massimo o minimo), l'indicatore non solo traccia un cerchio e la linea ZigZag che collega quel punto a quello precedente, ma ricalibra anche il potenziale canale di regressione lineare tracciato da quell'ultimo estremo.
• Se, durante le barre successive, il prezzo rimane all'interno delle bande, il canale resta attivo e si estende fino alla barra corrente.
• Se in qualsiasi momento il prezzo rompe quelle bande, l'indicatore “assume” che il canale sia stato invalidato e ne inizia uno nuovo dalla barra in cui si è verificata la rottura.
Indicatori del Ctrader Store:
Dynamic Market Structure
Analisi dei Punti di Inversione
Fibonacci Linear
Regressione Multi-timeframe
Multi-Level Candle Bias
Tracker
Auto Support and
Resistance Trend Lines
All Support and
Resistance Levels
Dynamic Market Structure Analysis of Turning Points
Fibonacci Linear Regression Multi-timeframe
Multi-Level Candle Bias Tracker
Auto Support and Resistance Trend Lines
Riepilogo
Recensioni dei clienti
5 | 50 % | |
4 | 50 % | |
3 | 0 % | |
2 | 0 % | |
1 | 0 % |


![Logo di "High-Low Divergence [Iridio Capital]"](https://cdn.ctrader.com/image/webp/443c4661-7abb-40f1-842f-4b6ec560649b_40914)
