

Descrizione
Indicatori Pinescriptlabs Store: Pinescriptlabs Store cBots : (cBot) Gold & BTC BreakoutSession Pivots(nuovo)
Proiezione Liquidità Prezzo ZigZag
Algoritmo Intelligente di Inseguimento (nuovo)
Mappa di Liquidazione della Leva
Previsione Basata su Linreg & ATR
Supporto & SmartTrend
Resistenza
Linee
Sistema di Breakout del Canale
Analisi
Dinamica della Struttura
di Mercato
dei
Punti
di Svolta
Regressione
Lineare
Fibonacci
Multi-timeframe
Proiezione del Flusso di Mercato
Gradiente di Tendenza Dinamico
Tracciatore
Bias Candele
Multi-Livello
Tracker
Tracciatore di Estremi Zig-Zag
Supporto
e Resistenza
Trend
Linee
Tutti
i Supporti e
le Resistenze
Livelli
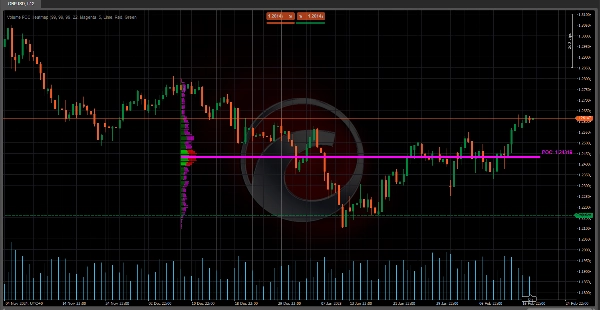
🔥 Mappa Termica Volume POC 🔥
Questo indicatore è un Profilo di Volume che mostra la distribuzione del volume scambiato su diversi livelli di prezzo durante un periodo specifico. Il suo obiettivo principale è identificare zone chiave di supporto/resistenza e aree dove il mercato ha mostrato maggior interesse (alta attività di acquisto/vendita). È molto utile per:
- Individuare il Punto di Controllo (POC) 🎯
Il livello di prezzo con il volume più alto, che agisce come un magnete per l’azione del prezzo. - Visualizzare l’Area di Valore (VA)
La zona dove è concentrata una percentuale specifica del volume totale (es. 70%), indicando equilibrio tra compratori e venditori. - Differenziare Volume Rialzista e Ribassista 📈📉
Mostra dove si accumula la forza di acquisto rispetto alla pressione di vendita.
🧠 Logica Chiave & Calcoli 🔢
- Divisione dell’Intervallo di Prezzo 📏
-
- L’intervallo di prezzo (dal minimo al massimo negli ultimi B Barre ) è diviso in Celle di Volume (CNum) .
Esempio: Se CNum = 33 , l’intervallo è suddiviso in 33 livelli equidistanti.
- L’intervallo di prezzo (dal minimo al massimo negli ultimi B Barre ) è diviso in Celle di Volume (CNum) .
- Distribuzione del Volume per Livello 📊
-
- Per ogni barra nei dati storici:
-
- Si calcola il volume associato al corpo (differenza tra apertura e chiusura) e alle ombre (massimi e minimi).
- Il volume è distribuito proporzionalmente sulle celle di prezzo attraversate dalla barra.
Esempio: Se una barra verde (rialzista) copre 3 celle, il volume è assegnato principalmente a quelle celle come "volume rialzista".
- Calcolo del Punto di Controllo (POC) 🎯
-
- Il POC è la cella con il volume accumulato più alto, rappresentando il prezzo dove c’è stato maggior consenso tra compratori e venditori.
- Calcolo dell’Area di Valore (VA) 🔄
-
- Si espande dal POC verso l’alto/basso fino a includere la % specificata del volume totale (es. 70%).
Esempio: Se la VA va da 100 a 105 , significa che il 70% del volume è stato scambiato in quell’intervallo.
- Si espande dal POC verso l’alto/basso fino a includere la % specificata del volume totale (es. 70%).
- Normalizzazione Visiva 🖼️
-
- I volumi sono scalati usando un Fattore di Scala per regolare la larghezza delle barre nel grafico, facilitando la visualizzazione.
🛠️ Chiave della Mappa Termica Volume POC 💡
- Mancanza di Contesto negli Indicatori di Volume Tradizionali 🤔
Gli indicatori di volume classici (come il volume barra per barra) non mostrano dove il volume è stato scambiato. Questo indicatore mappa il volume per livello di prezzo, risolvendo questo problema. - Identificazione Organica di Supporto/Resistenza 🚀
Le zone con alto volume agiscono come supporti/resistenze dinamici, più affidabili delle linee statiche. - Rilevazione di Squilibri ⚖️
Le aree con volume prevalentemente rialzista o ribassista segnalano potenziali breakout o inversioni.
💡 Uso Pratico nel Trading 📈
- POC come Zona di Interesse 🎯
-
- Se il prezzo si avvicina al POC, aspettarsi reazioni come rimbalzi o consolidamenti.
- Area di Valore (VA) come Zona di Equilibrio 🔄
-
- Se il prezzo è fuori dalla VA, tende a ritornarci (effetto magnetico).
- Se il prezzo è dentro la VA, può indicare consolidamento.
- Volume Rialzista/Ribassista come Conferma 🔍
-
- Un picco di volume rialzista in resistenza suggerisce un potenziale breakout.
- Alto volume ribassista in supporto indica una possibile rottura al ribasso.
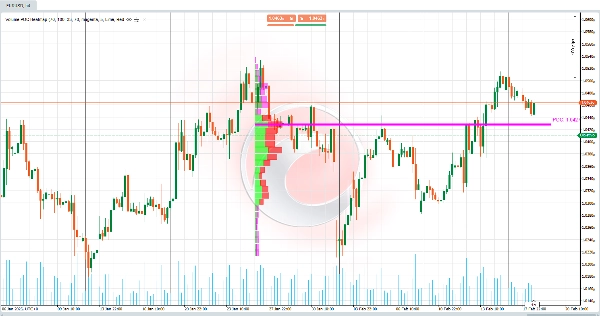
🌟 Esempio 📊
Parametri Utilizzati (Visibili & Configurabili dall’Utente):
- Barre Indietro = 55 → Numero di barre storiche analizzate.
- Celle di Volume = 33 → Numero di divisioni/celle nell’intervallo di prezzo.
- Percentuale Volume Area di Valore = 70 → Percentuale di volume che definisce l’Area di Valore.
Situazione:
- Il prezzo rompe un livello di supporto tecnico, ma il volume in quella zona è basso (secondo il profilo).
- Successivamente, il prezzo ritorna all’Area di Valore (VA) definita dal 70% del volume totale.
Interpretazione:
- La rottura è stata falsa (a causa del basso volume nella zona di breakout).
- Il mercato cerca di riequilibrarsi all’interno dell’Area di Valore , dove c’è maggiore attività (alta densità di volume).
Azione:
- Cercare opportunità di acquisto vicino al limite inferiore della VA o al POC, poiché queste sono zone di alto interesse per i partecipanti al mercato.
Riepilogo
Key functionalities include:
- Division of the price range into multiple volume cells for detailed volume mapping.
- Calculation of POC as the volume consensus price.
- Determination of the Value Area around the POC.
- Visual normalization of volume bars for clearer chart representation.
This tool addresses the limitation of traditional volume indicators by showing where volume was traded rather than just total volume per bar. It helps identify dynamic support and resistance zones based on volume concentration and detects volume imbalances that may signal potential breakouts or reversals. Traders can use it to anticipate price reactions near the POC and VA, aiding in decision-making for entries and exits. Configurable parameters include the number of historical bars analyzed, volume cells, and the percentage defining the Value Area.
Recensioni dei clienti
5 | 100 % | |
4 | 0 % | |
3 | 0 % | |
2 | 0 % | |
1 | 0 % |


![Logo di "Smart Money Concepts (SMC) [Iridio Capital]"](https://cdn.ctrader.com/image/webp/28b69fd1-ef54-4bed-9487-07e78e883be4_40934)


