Pinescritlabs
Ctrader Store indicators: 🤖Pinescritlabs Ctrader Store cBots:
Fair Value Gap Sessions Gold & BTC Breakout Session Pivots(new)
Dynamic Market Structure
Analysis of Turning Points
Fibonacci Linear
Regression Multi-timeframe
Multi-Level Candle Bias
Tracker
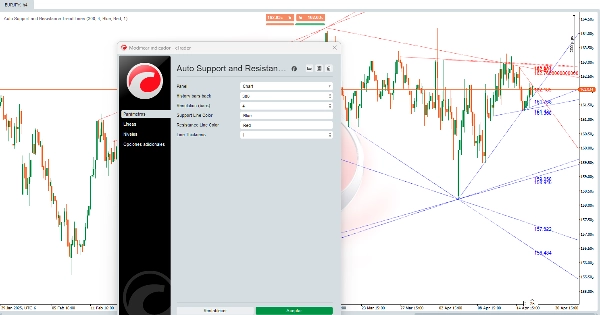
Auto Support and
Resistance Trend Lines
All Support and
Resistance Levels
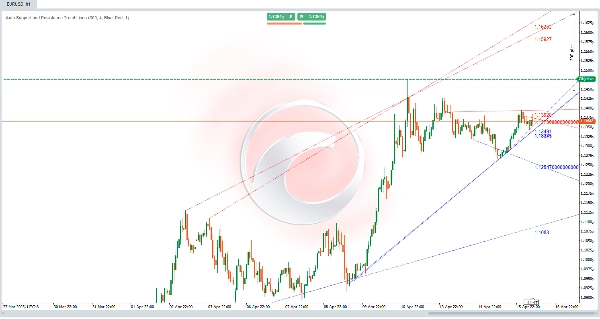
Auto Support and Resistance Trend Lines:
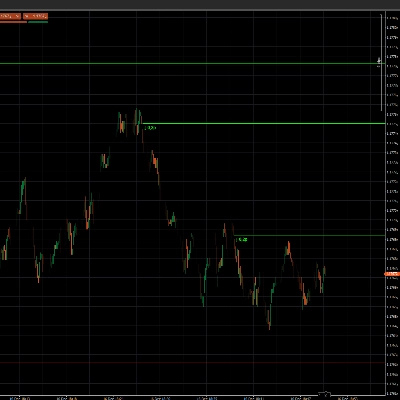
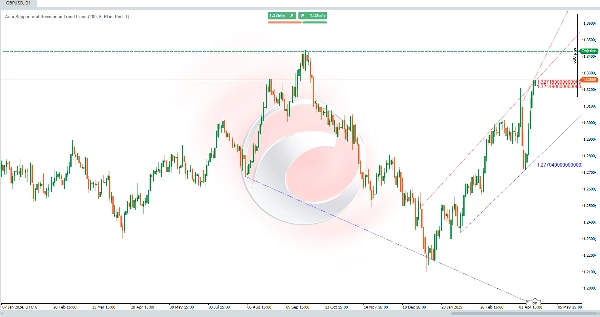
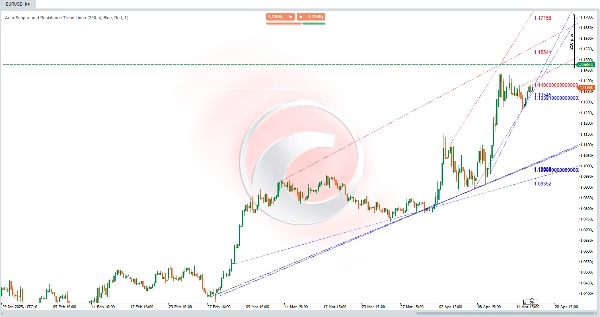
This algorithm is a powerful tool 🛠️ designed to automatically identify support and resistance levels on a price chart. Not only does it draw horizontal lines, but it also traces diagonal channels ↗️↘️ that represent market trends. These levels and channels are key areas where the price has struggled to move higher (resistance 🚧) or lower (support 🛡️), making them crucial points for trading decisions. 📈📉
How Are the Calculations Done? 🔍
The algorithm uses a price history analysis approach 📊 to identify support and resistance levels. Here’s how it works:
- Identification of Local Lows and Highs ⬇️⬆️
- The algorithm analyzes the price over a specific range of bars (candles) to find local lows (the lowest prices in that range) and local highs (the highest prices in that range).
- These local lows and highs are potential candidates to become support and resistance levels.
- Validation of Levels ✔️
- Once local lows and highs are identified, the algorithm checks whether these levels have been respected by the price in the past.
- If the price has touched a level multiple times without clearly breaking it, it is considered a valid support or resistance level.
- Drawing Lines and Channels ✏️
- Support levels are drawn as horizontal (or diagonal) lines at validated local lows.
- Resistance levels are drawn as horizontal (or diagonal) lines at validated local highs.
- Additionally, the algorithm connects these levels to form diagonal channels ↗️↘️, which represent bullish or bearish trends in the market.
- Dynamic Updates 🔄
- The indicator automatically updates with each new bar, recalculating and redrawing support and resistance levels based on the most recent price behavior.
How Does This Algorithm Help Traders? 💡
This algorithm is a game-changer for traders because:
- Provides a Macro View of the Market 🌐
- By drawing diagonal channels, the algorithm shows the main market trends, helping traders identify whether the price is in an uptrend 📈, downtrend 📉, or sideways movement ↔️.
- Identifies Key Support and Resistance Areas 🎯
- Support and resistance levels are zones where the price may bounce or break. These levels are useful for:
- Setting entry and exit points for trades.
- Placing stop-loss 🛑 and take-profit ✅ orders.
- Identifying breakouts 🚀 or reversals 🔄 in price.
- Simplifies Technical Analysis 🕒
- The algorithm automates the process of identifying support and resistance, saving time for traders who perform manual analysis.
- By clearly displaying levels and channels, it helps traders make more informed decisions.
- Customizable 🎨
- Traders can adjust parameters such as the number of historical bars analyzed, line thickness, and colors, allowing the indicator to be tailored to different trading styles and visual preferences.
Practical Example 📌
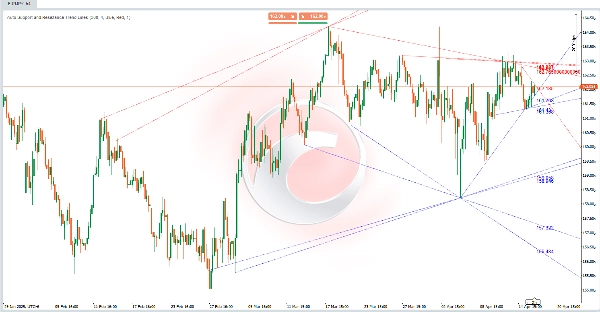
Imagine you’re analyzing a price chart, and the algorithm has drawn:
- A diagonal support line ↗️ connecting several local lows, indicating an uptrend.
- A diagonal resistance line ↗️ connecting several local highs, showing an upward channel.
- Several horizontal lines representing key support and resistance levels.
With this information, you can:
- Identify that the price is in an uptrend 📈.
- Look for buying opportunities near the diagonal support line or horizontal support levels.
- Set a stop-loss 🛑 below the nearest support level.
- Observe whether the price breaks the resistance to confirm a continuation of the trend or a potential reversal 🔄.